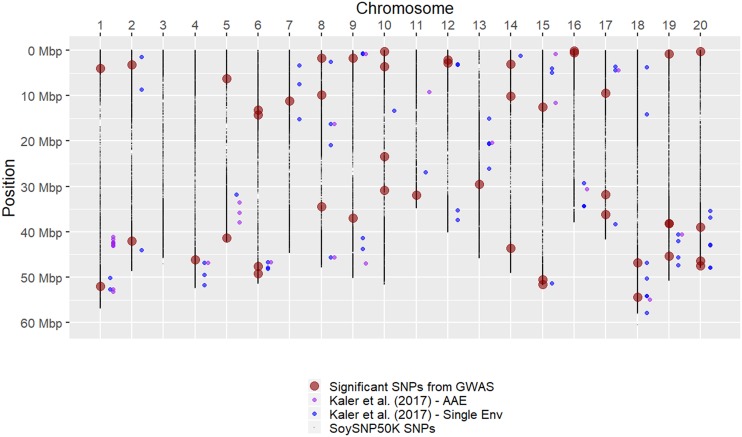
Figure 4.
Location and comparison of SNPs significantly associated with canopy wilting based on association mapping results. Physical positions are based on the Glyma.Wm82.a2 version of the soybean genome. SNPs identified in GWAS that met -log10(P) > 4 significance threshold are shown as large red colored circles. Average of all environments (AAE) and single environment (Env) significant SNPs from Kaler et al. (2017b) are shown as purple and blue circles, respectively. Position locations were converted from version 1 to 2 of the soybean genome assembly for the Kaler et al. (2017b) SNPs, so that comparisons were made using the same physical positions. ss715637687 found in AAE for Kaler et al. (2017b) is not in version 2 of soybean genome assembly, and therefore not included in this comparison.

