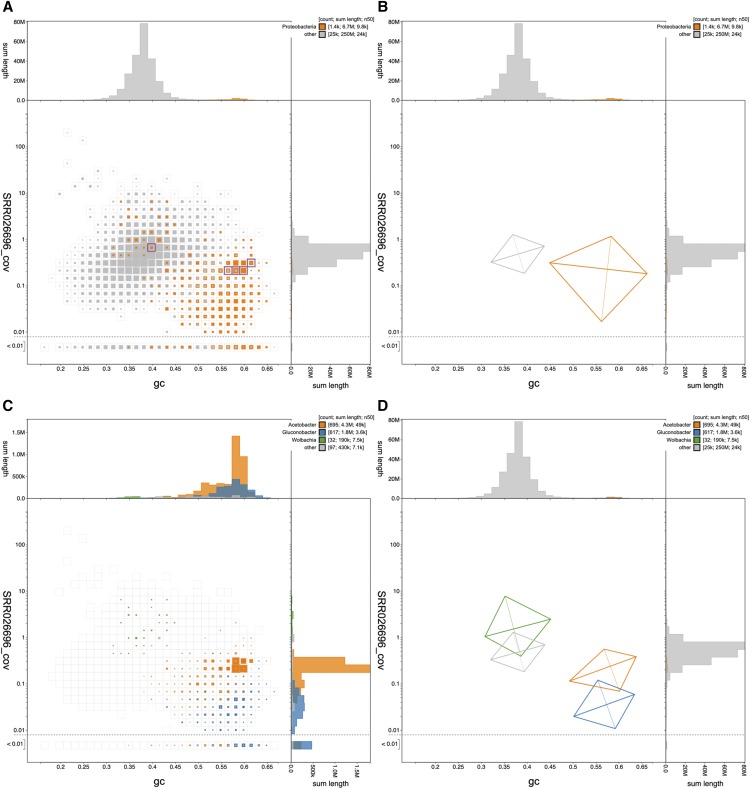
Figure 3.
Blobplot of base coverage in read set SRR026696 against GC proportion for scaffolds in Drosophila albomicans assembly ACVV01. (A & B) Scaffolds are colored by phylum with Proteobacteria highlighted in orange and all other phyla grouped together in gray. Histograms show the distribution of scaffold length sum along each axis. (A) Square-binned blob plot at a resolution of 30 divisions on each axis. Colored squares within each bin are sized in proportion to the sum of individual scaffold lengths on a logarithmic scale, ranging from 867 to 40,536,114. The bins highlighted in pink contain a total of 5 scaffolds that have been annotated as Proteobacteria but that contain BUSCOs using the diptera_odb9 BUSCO set. (B) A simplified representation of the distributions of scaffolds assigned to each phylum highlights the difference in GC proportion and coverage of Proteobacteria scaffolds. Each kite has a pair of lines representing two standard deviations about the mean on each axis (weighted to account for scaffold lengths) that intersect at a point representing the weighted median. They are angled according to a weighted linear regression equation to indicate the relationship between coverage and GC proportion. (C) Assembly filtered to exclude non-proteobacterial scaffolds. Scaffolds are colored by genus with Acetobacter highlighted in orange, Gluconobacter shown in blue and Wolbachia shown in green. Colored squares within each bin are sized in proportion to the sum of individual scaffold lengths on a square-root scale, ranging from 1,005 to 771,195. (D) A simplified representation of the distributions of scaffolds assigned to each genus highlights the difference in GC proportion and coverage of Acetobacter, Gluconobacter and Wolbachia scaffolds. This figure can be regenerated, and explored further, using the URLs given in File S1. The list of scaffolds highlighted in (A) is available in File S2.

