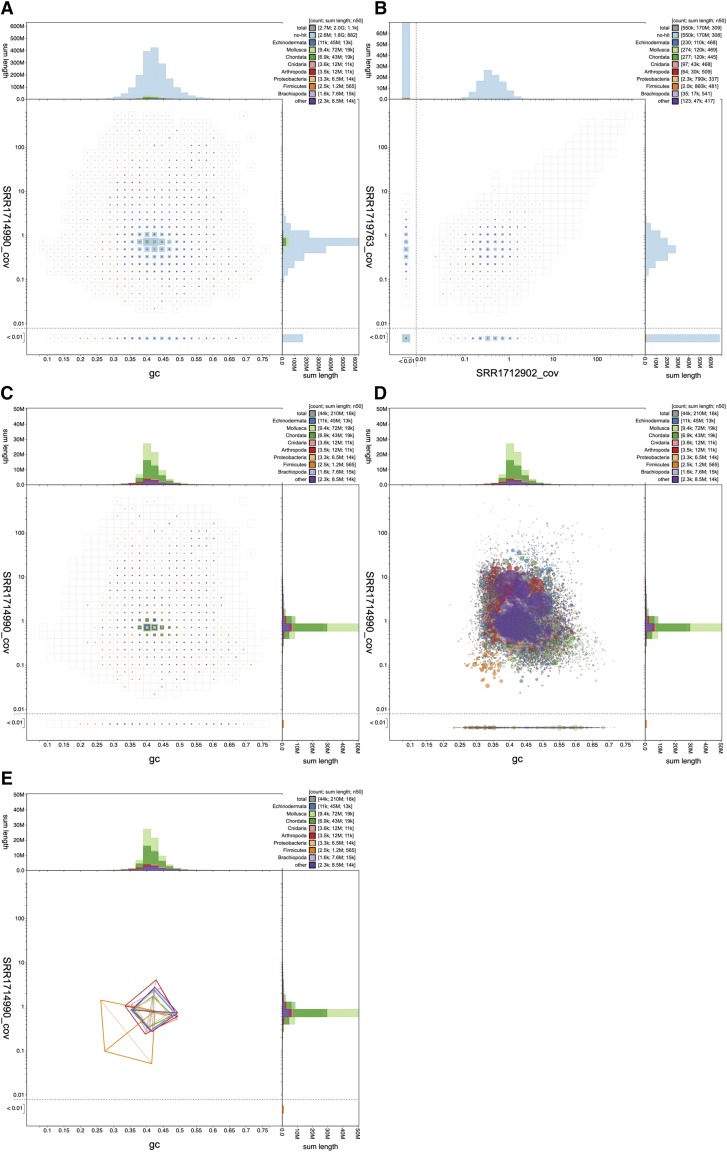
Figure 4.
Visualization of the highly fragmented Conus consors assembly SDAX01. (A) Binned distribution of all 2,688,687 assembly scaffolds shows unimodal distributions in GC proportion and coverage axes. The majority of scaffolds lack a taxonomic annotation (assigned to “no-hit”). (B) Square-binned plot of coverage in read set SRR1719763 against coverage in SRR1712902 for scaffolds with coverage <= 0.01 in read set SRR1714990. The extent of the unfiltered distribution is indicated by the empty square bins. (C) In the interactive browser datasets with over 1,000,000 scaffolds are presented with the “no-hit” scaffolds filtered out to reduce computation. In this case, 43,857 scaffolds are plotted in the filtered dataset. (D) A non-binned presentation of the same data shows the challenges of interpreting a dataset plotted as a large number of overlapping circles, even after filtering “no-hit”. (E) A simplified representation of the distributions of scaffolds assigned to each phylum highlights the difference in GC proportion and coverage of scaffolds assigned to Firmicute. This figure can be regenerated, and explored further, using the URLs given in File S1.

