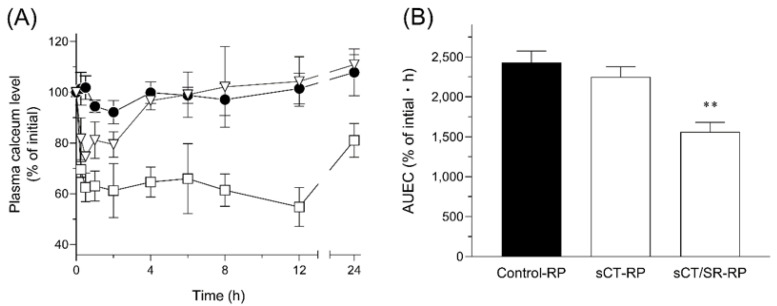
Figure 5.
Hypocalcemic action of sCT after the intratracheal administration of sCT samples in rats (40 µg-sCT/kg, i.t.). (A) Time transitions of plasma calcium levels after the administration of sCT samples and (B) AUEC0–24 h of each group. ●, control-RP; ▽, sCT-RP; and □, sCT/SR-RP. Data represent mean ± SE of 4–6 experiments. **, p < 0.01 with respect to the control-RP group.

