Table 1.
The inhibitory potencies of selected psoralen derivatives against the Mtb proteasome. Inhibition data for IP is added to evaluate selectivity profile of compounds.
| Compound | Chemical Structure | IC50 (µM) and (Hill Coefficient) | Ki and Type of Inhibition a | RA b at 10 µM (%) or Ki or IC50 (µM) against ß5i of IP (refs [41,42]) |
|---|---|---|---|---|
| Bortezomib |
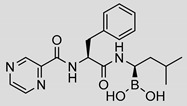
|
0.11 ± 0.03 (0.76) |
Ki = 133 ± 5 nM Mixed inhibition (R2 = 0.94, α = 0.85) (Slow) reversible inhibition |
IC50 = 0.004 µM (ref [35]) |
| PR-957 |
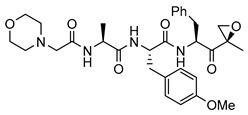
|
2.2 ± 1.0 (0.91) |
kinact/Ki = 96 ± 41 M−1·s−1 Ki = 5.2 ± 1.9 µM Noncompetitive inhibition (R2 = 0.83) Irreversible inhibition |
IC50 = 0.015 ± 0.002 µM (ref [41]) |
| 1 |
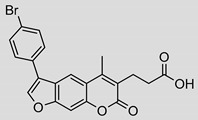
|
39 ± 7 (0.69) |
ND | Ki = 137 ± 33 µM |
| 2 |
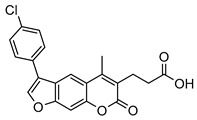
|
15 ± 2 (1.75) |
ND | 83% |
| 3 |
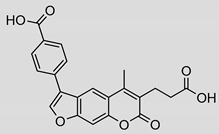
|
31 ± 5 (1.22) |
ND | 53% |
| 4 |
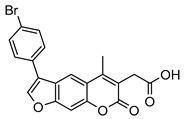
|
4 ± 3 (1.59) |
ND | Ki = 12.7 ± 3.7 µM |
| 5 |
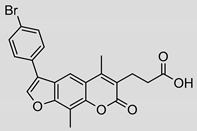
|
17 ± 3 (0.70) |
ND | 93% |
| 6 |

|
2.2 ± 0.3 (0.70) |
ND | 82% |
| 7 |

|
8 ± 5 (0.42) |
ND | 100% |
| 8 |

|
3.7 ± 1.5 (1.05) |
Ki = 5.6 ± 20.8 µM Mixed inhibition (R2 = 0.54, α = 0.19) Reversible inhibition |
100% |
| 9 |

|
2 ± 2 (2.27) |
ND | 66% |
| 10 |

|
3 ± 2 (4.46) |
ND | 100% |
| 11 |

|
8.8 ± 1.0 (0.90) |
Ki = 4.2 ± 2.1 µM Mixed inhibition (R2 = 0.91, α = 6.67) (Partially) reversible inhibition |
IC50 = 0.94 ± 1.1 µM |
| 12 |

|
5 ± 2 (1.05) |
ND | IC50 = 1.8 ± 0.4 µM |
| 13 |
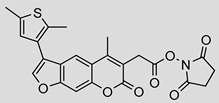
|
3.2 ± 0.3 (0.90) |
Ki = 1.1 ± 0.9 µM Mixed inhibition (R2 = 0.52, α = 6.94 × 10^16) (Partially) reversible inhibition |
IC50 = 4.4 ± 0.1 µM |
| 14 |
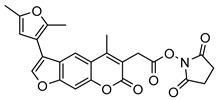
|
9 ± 5 (2.42) |
ND | IC50 = 6.9 ± 2.1 µM |
| 15 |

|
5.8 ± 2.1 (0.55) |
Ki = 14.9 ± 45.0 µM Mixed inhibition (R2 = 0.77, α = 0.22) Reversible inhibition |
ND |
aKi determined with GraphPad Prism by fitting the data to several inhibition models (mixed, competitive, noncompetitive, uncompetitive). The best scoring model was further examined by creating Dixon, Lineweaver-Burk and Michaelis-Menten plots. Km for Suc-LLVY-AMC is 60 ± 15 µM (see Supplementary data for details). ND, not determined. b The data were calculated as residual activities (RAs) of β5i in the presence of 10 μM of each compound (standard errors for RAs were < 15%).
