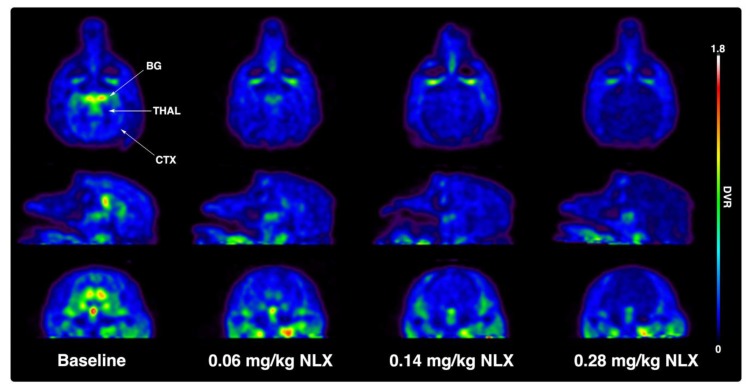
Figure 1.
Representative transverse (top row), sagittal (middle row), and coronal (bottom row) monkey positron emission tomography (PET) images of a [11C]CFN baseline scan and following blocking studies with low (0.06 mg/kg), medium (0.14 mg/kg), and high (0.28 mg/kg) doses of naloxone (NLX). Images are distribution volume ratio (DVR) images summed 0–60 min following intravenous (IV) injection of the radiotracer. BG = basal ganglia, THAL = thalamus, CTX = cortex.

