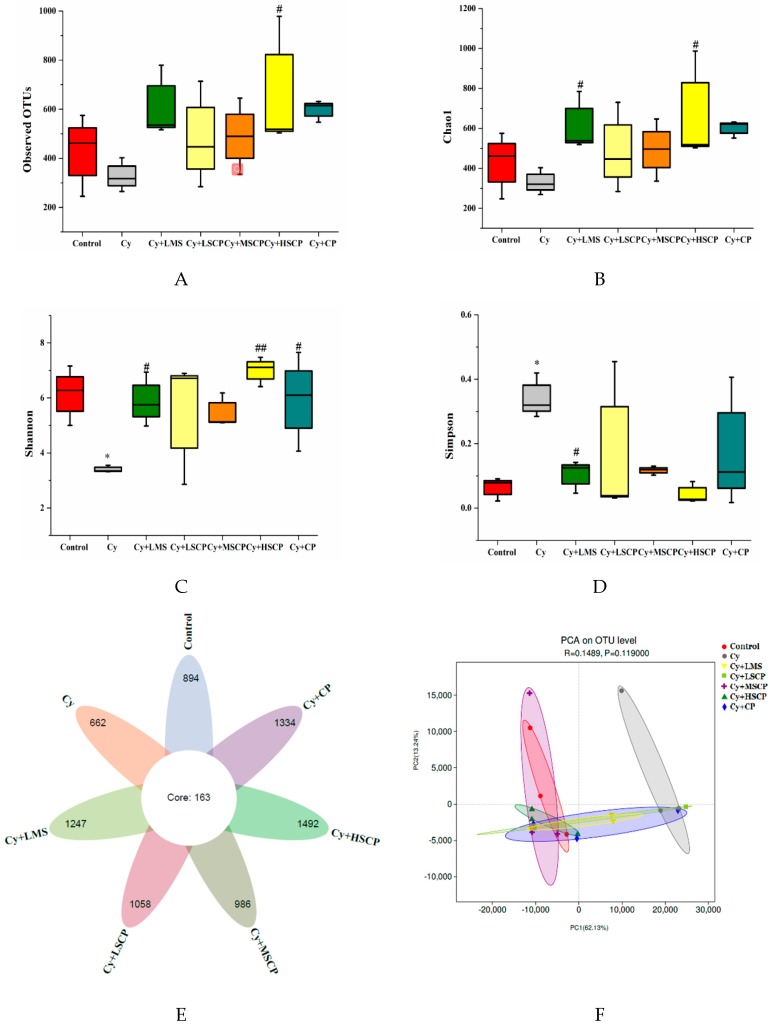
Figure 4.
Diversity of bacterial communities and the structures of the mouse intestinal microbiota in different treatment groups. (A–D) Alpha diversity was evaluated by (A) observed OTUs, (B) Chao1 index, (C) Shannon index, and (D) Simpson index. (E) Venn diagrams of the five groups. (F) Principal coordinate analysis based on OTU. The values expressed as mean ± SD, n = 5. * p < 0.05, compared to the control group; # p < 0.05, ## p < 0.01 compared to the Cy group.

