Figure 3.

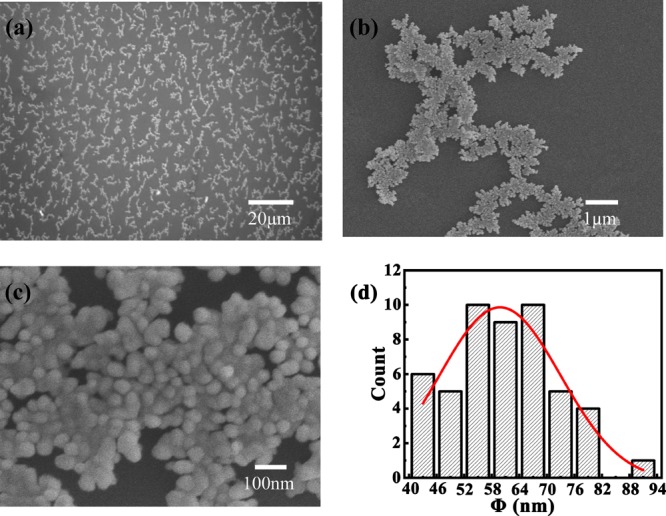
(a–c) SEM images of a Ag film with various magnifications; (d) statistical distribution of dimensions of 50 Ag nanoparticles. The solid curve is the Gaussian distribution fitting to the experimental data.

(a–c) SEM images of a Ag film with various magnifications; (d) statistical distribution of dimensions of 50 Ag nanoparticles. The solid curve is the Gaussian distribution fitting to the experimental data.