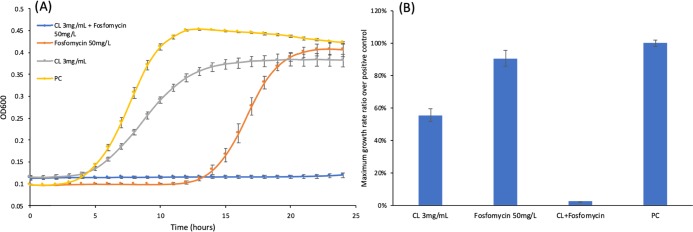
Figure 2.
Cell growth test with chlorogenic acid and fosfomycin. (A) Comparison of the growth curves of L. monocytogenes under different chemical treatment conditions. (B) Maximum growth rate normalized with the positive control of L. monocytogenes. CL: chlorogenic acid; triplicate samples; error bar: standard deviation; and PC: positive control (L. monocytogenes overnight culture was diluted with 5% dimethyl sulfoxide (DMSO)).

