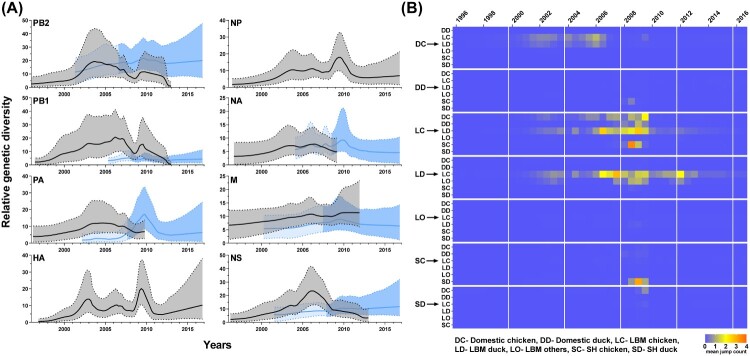
Figure 5.
Gaussian Markov random field Bayesian skyline plot of eight genes from H9N2 viruses and time-delimited Markov jump count of the HA gene. (A) Each segment of the H9N2 virus was used to calculate the relative genetic diversity over time. Linear lines and shaded areas bounded by dotted lines represent the mean relative genetic diversity and 95% highest posterior density value, respectively. Black lines and adjacent grey areas represent the MS96 group. Blue lines and the adjacent blue area represent the W113 group. The blue shaded area with contrast separate W113 group genes into presence in Korean wild aquatic bird (light blue) and in Korean poultry (deep blue). Time points of the separation were inferred from a TMRCA of Korean poultry in each segment. (B) Mean jump counts of HA gene over time were calculated between ecological state and visualized by heat maps.

