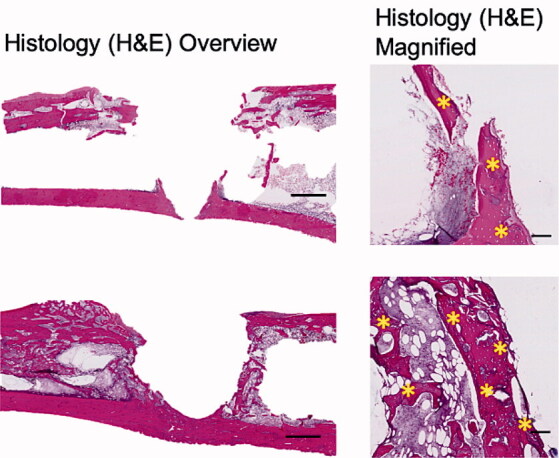
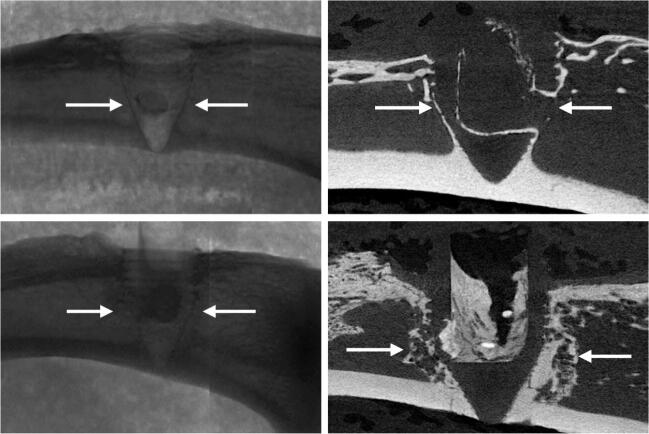
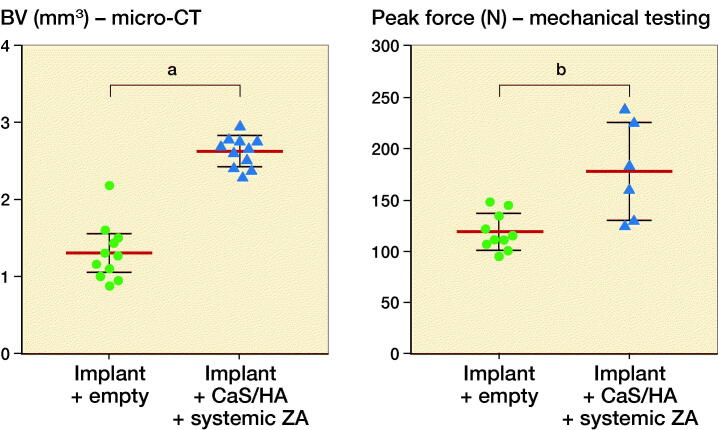
Figure 3.
Biological effect of hydroxyapatite biomodulation assessed in the implant integration model in rats. Top panel shows representative radiograph, micro-CT slice, histology overview (H&E staining), and high magnification histology (H&E staining), respectively from the Implant + empty group while the middle panel shows images from the Implant + CaS/HA + systemic ZA group. Bottom left indicates micro-CT quantification of bone volume (BV) immediately around the implant holes and bottom right shows peak pull-out force. In the histology images * indicates new bone formation around the implant. Scale bar in the overview histology images represents 1 mm and magnified images represents 100 µm. aindicates p < 0.001 and bindicates p < 0.01 (Mann–Whitney U-test). Data for the empty group are taken from an earlier study for comparison (Raina et al. 2019).


