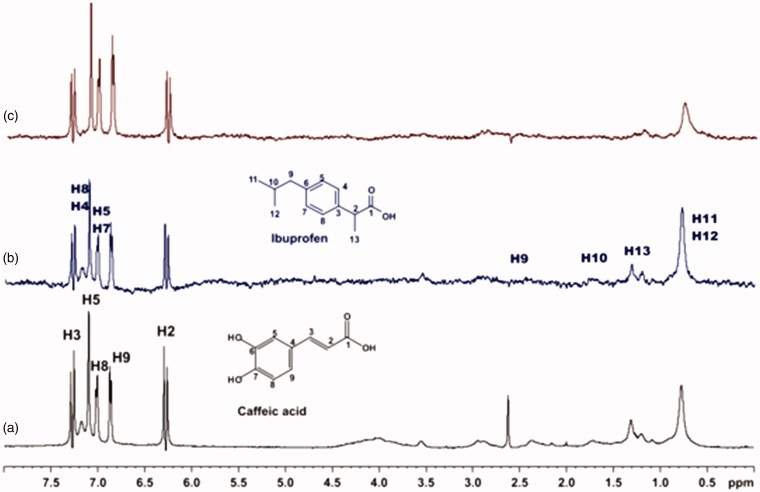
Figure 11.
(a) 1H NMR reference spectrum of the complex caffeic acid (2 mM) – BSA (50 μΜ), including ibuprofen 2 mM, in PBS buffer 10 mM, pH = 7.4 with 600 μL D2O. STD difference NMR spectrum of the complex caffeic acid–BSA, including: (b) 2 mM ibuprofen (c) 4 mM ibuprofen (details for the protons of caffeic acid in Supplementary Figure S5 and for ibuprofen in Supplementary Figure S14).

