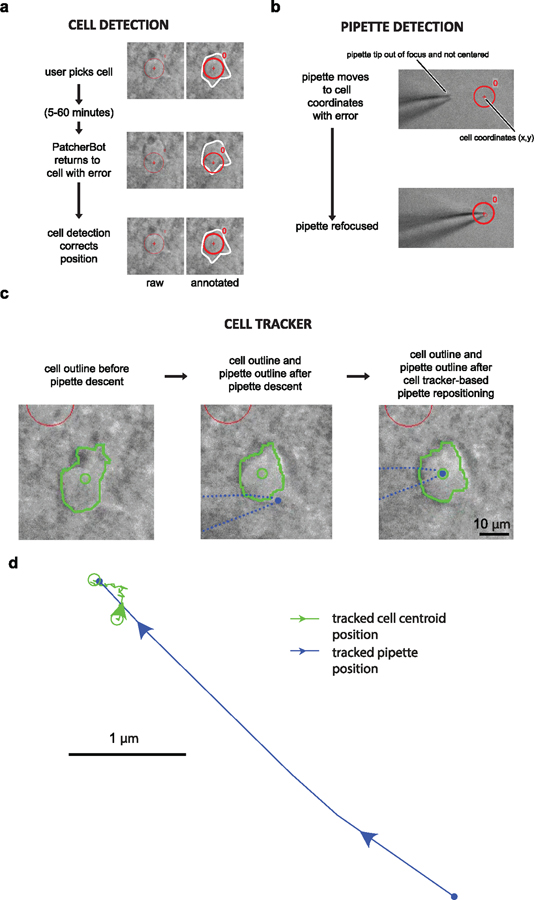
Figure 3.
Machine vision elements in brain slices. (a) Sequence of events for cell detection. After the user initially picks the cell (top panels), the system comes back to patch-clamp it after 5–60 min with some inaccuracy (middle panel). The cell detection procedure re-centers the cell (bottom panel). Images on the left show raw screen capture frames, images on the right are annotated for clarity. Red circle and crosshair show the expected cell location; white outline shows actual cell boundary. Circle diameter: 10 µm. (b) Before (top) and after (bottom) the pipette detection state. The algorithm successfully refocused on the pipette after it entered the field of view off-center. (c) Sample cell tracking results. See supplementary video 3 (cell tracker ON) for real-time video of this trial. Cell boundaries (green outline) are automatically tracked and the centroid (green circle) is computed. Pipette tip location on the screen is estimated from the manipulator position (blue dot). Left: cell boundary before pipette descent. Center: cell position and pipette position after pipette descent. Right: cell position and pipette position after trajectory adjustment. Red circle on top left of images is a different cell. (d) Cell centroid position (green) and pipette position (blue) during the ‘approach cell’ state. The pipette moves laterally towards the tracked cell centroid. Same attempt as in (c) and supplementary video 3.

