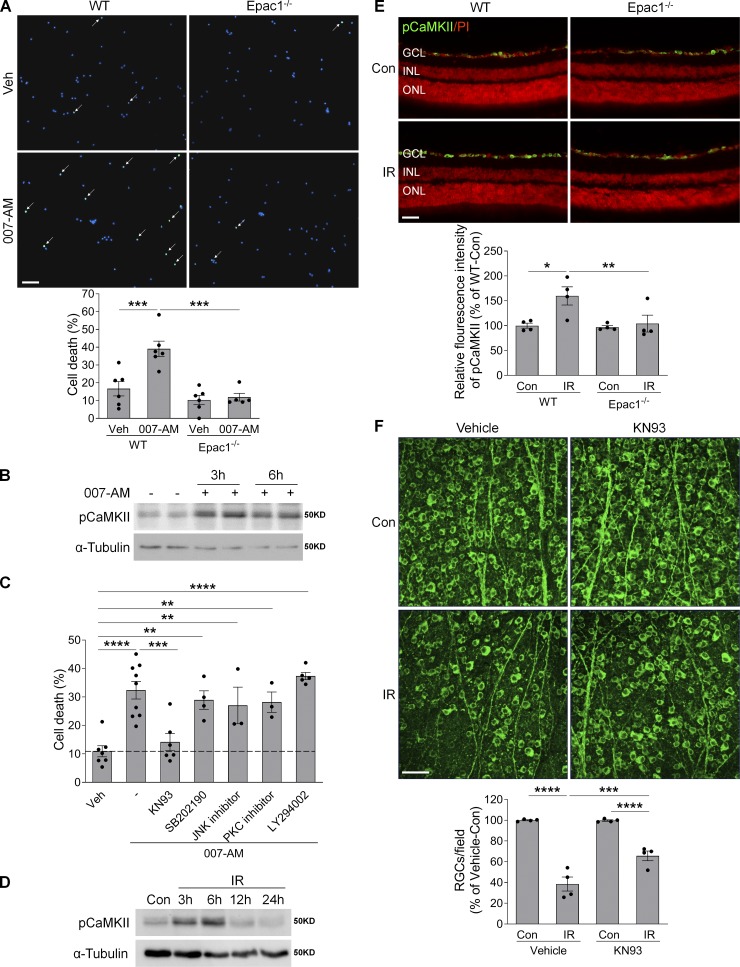
Figure 9.
Epac1 activation promotes RGC death through pCaMKII. (A) Primary mouse RGCs isolated from WT and Epac1−/− pups were treated with 007-AM (10 µM) or vehicle for 18 h. Cell death was determined by TUNEL assay. n = 5–6; five images were taken randomly for each sample and calculated as average value. (B) The expression of pCaMKII in primary RGCs treated with 007-AM (10 µM). n = 3. (C) Primary RGCs isolated from WT pups were treated with 007-AM (10 µM) in the presence of different inhibitors for 18 h, and cell death was determined by TUNEL assay. n = 3–9; five images were taken randomly for each sample and calculated as average value. (D) The expression of pCaMKII in retinas at various time points after IR by Western blotting. (E) The expression of pCaMKII (green) in retinal sections from WT and Epac1−/− mice 3 h after IR. Red, PI staining. n = 4 mice. Immunostaining intensity was quantified from three independent observed areas of each retinal section. For each eye, data from three sections were averaged. (F) Representative images of retinal flatmounts labeled with Tuj1 antibody (green) 7 d after IR in vehicle or KN93-treated WT mice. Bar graph represents the percentage of Tuj1-positive cells per field relative to vehicle-treated control retinas. n = 4 mice; eight images were taken at the peripheral retina for each sample and calculated as average value. *, P < 0.05; **, P < 0.01; ***, P < 0.001; ****, P < 0.0001; one-way ANOVA. Scale bar: 50 µm. ONL, outer nuclear layer. Error bars represent SEM.

