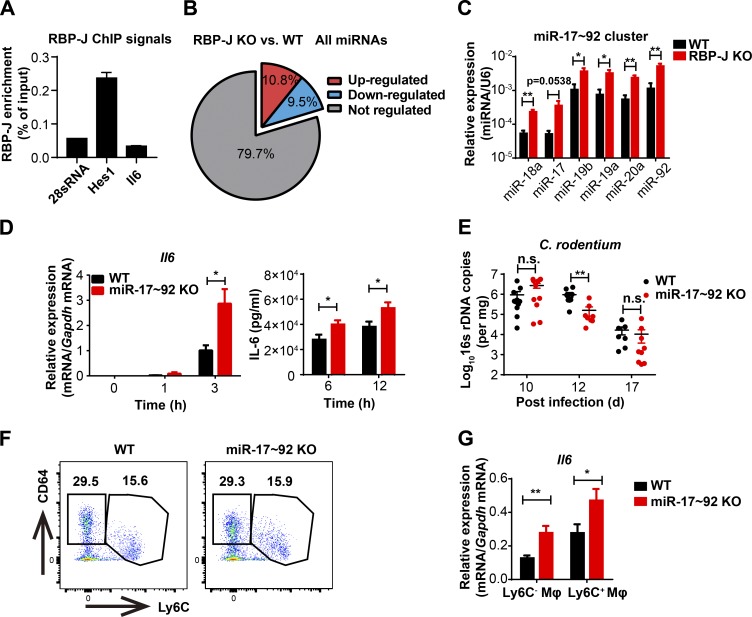
Figure 4.
RBP-J promotes IL-6 production by releasing miR-17∼92 cluster–imposed inhibition. (A) RBP-J occupancy at the promoters of Hes1 and Il6 was analyzed by ChIP-qPCR in WT BMDMs. Data are from one representative experiment of two independent experiments. (B) A pie graph showing the percentages of RBP-J–up-regulated and down-regulated miRNAs among all miRNAs. (C) qPCR analysis of the miR-17∼92 cluster in sorted LP CD64+Ly6C− colonic macrophages. Data are pooled from two independent experiments. (D) WT (Lyz2-Cre) and miR-17∼92 KO (miR-17∼92fl/fl Lyz2-Cre) BMDMs were stimulated with heat-killed C. rodentium (MOI = 0.5) at the indicated time points. IL-6 levels were determined by qPCR (left) and ELISA (right). Data are pooled from three independent experiments. (E–G) WT and miR-17∼92 KO mice were orally inoculated with 4 × 10⁹ CFUs of C. rodentium, and colonic LP mononuclear cells were isolated at day 5 p.i. (E) qPCR analysis of 16s rDNA copies to determine fecal bacterial burdens in colon. Data are pooled from two independent experiments; n ≥ 3 in each group. (F) Representative FACS plots of LP colonic macrophage subsets. (G) qPCR analysis of Il6 in sorted CD64+Ly6C− and CD64+Ly6C+ colonic macrophages. Data are pooled from two independent experiments; n = 3 in each group. Data are shown as mean ± SEM; n.s., not significant; *, P < 0.05; **, P < 0.01; two-tailed Student’s unpaired t test (C and G), two-tailed Student’s paired t test (D), or two-tailed Mann-Whitney test (E). Each symbol in E represents an individual mouse.

