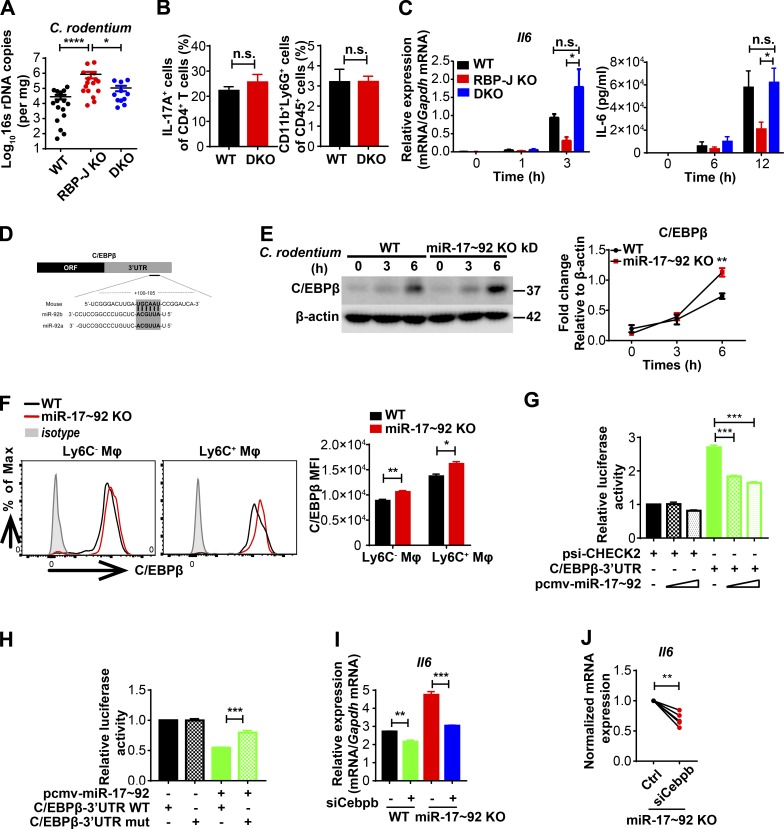
Figure 5.
RBP-J regulates host responses to C. rodentium by targeting the miR-17∼92–C/EBPβ axis. (A and B) WT, RBP-J KO, and DKO (Rbpjfl/fl miR-17∼92fl/fl Lyz2-Cre) mice were orally inoculated with 2 × 10⁹ CFUs of C. rodentium. (A) qPCR analysis of 16s rDNA copies to determine fecal bacterial burdens in colon at day 14 p.i. Data are pooled from three independent experiments; n ≥ 3 in each group. (B) Colonic LP mononuclear cells were isolated at day 7 p.i. Cumulative data of IL-17A production in CD3+CD4+ T cells (left) and LP neutrophils (right) are shown. Data are pooled from two independent experiments; n = 3 in each group. (C) BMDMs were stimulated with heat-killed C. rodentium (MOI = 0.5). IL-6 levels were determined by qPCR (left) and ELISA (right). Data are pooled from three independent experiments. (D) Schematic illustration of the predicted targeting sites for the miR-17∼92 cluster within the 3′ UTR of Cebpb mRNA. (E) Immunoblotting analysis (left) and densitometrical quantitation of cumulative data from three independent experiments (right) of C/EBPβ in whole-cell lysates of BMDMs treated with heat-killed C. rodentium (MOI = 0.5) for various times (top lanes). (F) Representative FACS plots (left) and cumulative MFI (right) of C/EBPβ expression in colonic macrophages at day 5 p.i. Data are pooled from two independent experiments; n = 3 in each group. (G and H) Luciferase reporter plasmid (psi-CHECK2) containing the C/EBPβ 3′ UTR (G) or 3′ UTR mutant (H) and various doses of pCMV-miR17∼92 plasmids were cotransferred into HEK293T cells. Luciferase activities were determined and normalized to the condition with empty reporter plasmid alone. Data are pooled from three independent experiments. (I and J) qPCR analysis of Il6 in BMDMs transfected with siCebpb or control siRNA with LPS stimulation for 3 h. Representative data of one experiment (I; mean and SEM of triplicate measurements) and cumulative data from three independent experiments (J). Data are shown as mean ± SEM; n.s., not significant; *, P < 0.05; **, P < 0.01; ***, P < 0.001; ****, P < 0.0001; two-tailed Mann-Whitney test (A), two-tailed Student’s paired t test (C and J), or two-tailed Student’s unpaired t test (other panels). Each symbol in A represents an individual mouse.

