Figure S1.
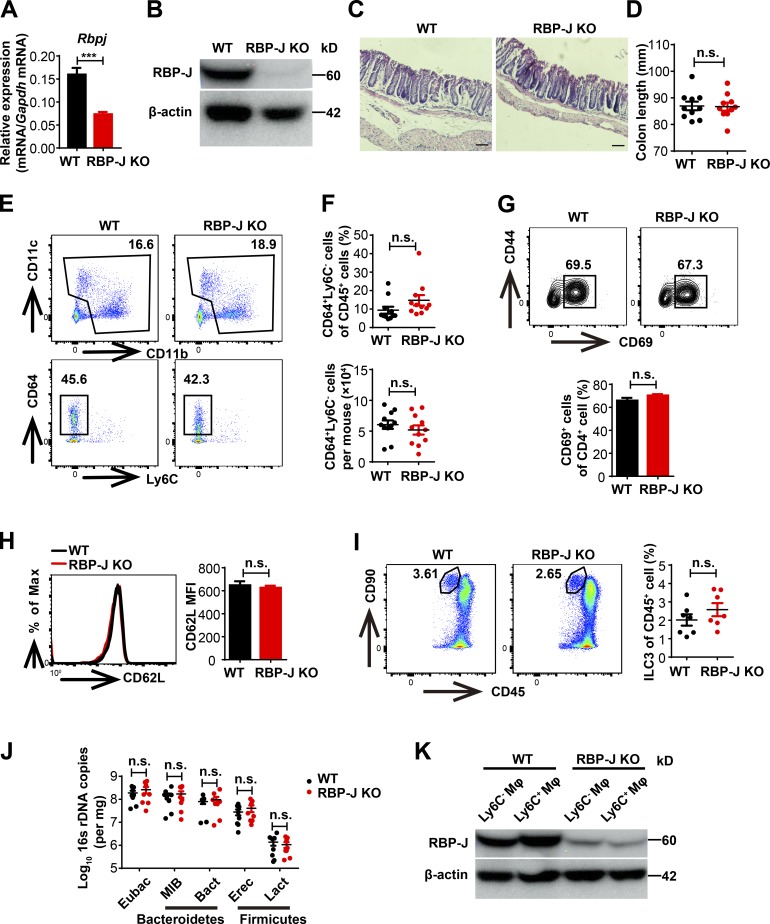
WT and RBP-J KO mice display similar colonic architectures and abundance of commensal bacteria in homeostasis. (A and B) qPCR (A) and immunoblotting analysis (B) of RBP-J expression in sorted LP CD64+Ly6C− colonic macrophages from WT (Lyz2-Cre) and RBP-J KO (Rbpjfl/fl Lyz2-Cre) mice under the resting state. Data are pooled from two independent experiments (A); n = 3 in each group. (C) Histological analysis of distal colonic tissues by H&E staining under resting state (scale bars represent 50 µm). (D) Measurements of colon lengths in resting state. Data are pooled from three independent experiments; n ≥ 3 in each group. (E–I) LP mononuclear cell populations from 6–8-wk-old uninfected WT and RBP-J KO mice were determined by FACS. Data are pooled from two (G–I) or three (F) independent experiments; n ≥ 3 in each group. (E and F) Representative FACS plots (E) and cumulative data (F) quantitating percentages and cell numbers of CD64+Ly6C− colonic macrophages. (G–I) Representative FACS plots and cumulative data quantitating percentages of CD69+ cells out of CD4+ T cells (G), CD62L expression on CD4+ T cells (H), and ILC3 (CD45midCD3−Thy-1+) populations (I). (J) qPCR analysis of specific bacterial 16s rDNA copies in colon from cohoused WT and RBP-J KO mice in resting state. Data are pooled from three independent experiments; n ≥ 3 in each group. (K) Immunoblotting analysis of RBP-J protein in sorted LP CD64+Ly6C− and CD64+Ly6C+ colonic macrophages at day 5 p.i. Data are shown as mean ± SEM; n.s., not significant; ***, P < 0.001; two-tailed Mann-Whitney test (J) or two-tailed Student’s unpaired t test (other panels). Each symbol in D, F, I, and J represents an individual mouse.

