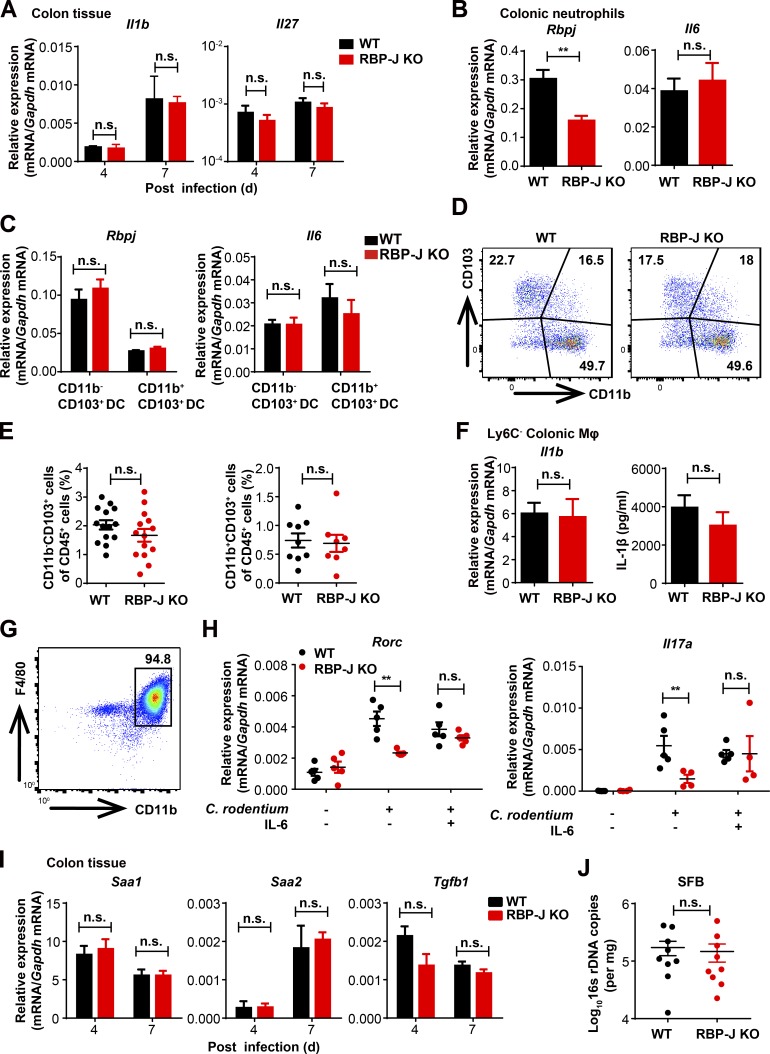
Figure S3.
RBP-J KO mice display normal functions of DCs and neutrophils. (A) qPCR analysis of Il1b and Il27 in colon tissues from WT and RBP-J KO mice at the indicated p.i. days. Data are pooled from two independent experiments, n = 3 in each group. (B–F) WT and RBP-J KO mice were orally inoculated with 2 × 10⁹ CFUs of C. rodentium, and colonic LP mononuclear cells were isolated at day 5 p.i. Data are pooled from two (B, C, and F) or three (E) independent experiments. (B and C) qPCR analysis of Rbpj and Il6 in sorted CD11b+Ly6G+ colonic neutrophils (B) and CD11b−CD103+ and CD11b+CD103+ colonic DCs (C). (D and E) Representative FACS plots (D) and cumulative data (E) quantitating LP CD11c+MHCII+ DC subpopulations. (F) IL-1β levels in sorted CD64+Ly6C− colonic macrophages were determined by qPCR analysis (left) and ELISA (right). (G) FACS analysis of replated peritoneal cells intraperitoneally administrated with thioglycollate. (H) qPCR analysis of Rorc (left) and Il17a (right) mRNA expression in cultured CD4+ T cells performed as in Fig. 3 F. Data are pooled from three independent experiments. (I) qPCR analysis of indicated mRNAs in colon tissues from infected WT and RBP-J KO mice. Data are pooled from two independent experiments; n = 3 in each group. (J) qPCR analysis of segmented filamentous bacteria (SFB) in colon from WT and RBP-J KO mice at day 7 p.i. Data are pooled from two independent experiments; n ≥ 3 in each group. Data are shown as mean ± SEM; n.s., not significant; **, P < 0.01; two-tailed Mann-Whitney test (J) or two-tailed Student’s unpaired t test (other panels). Each symbol in J represents an individual mouse.

