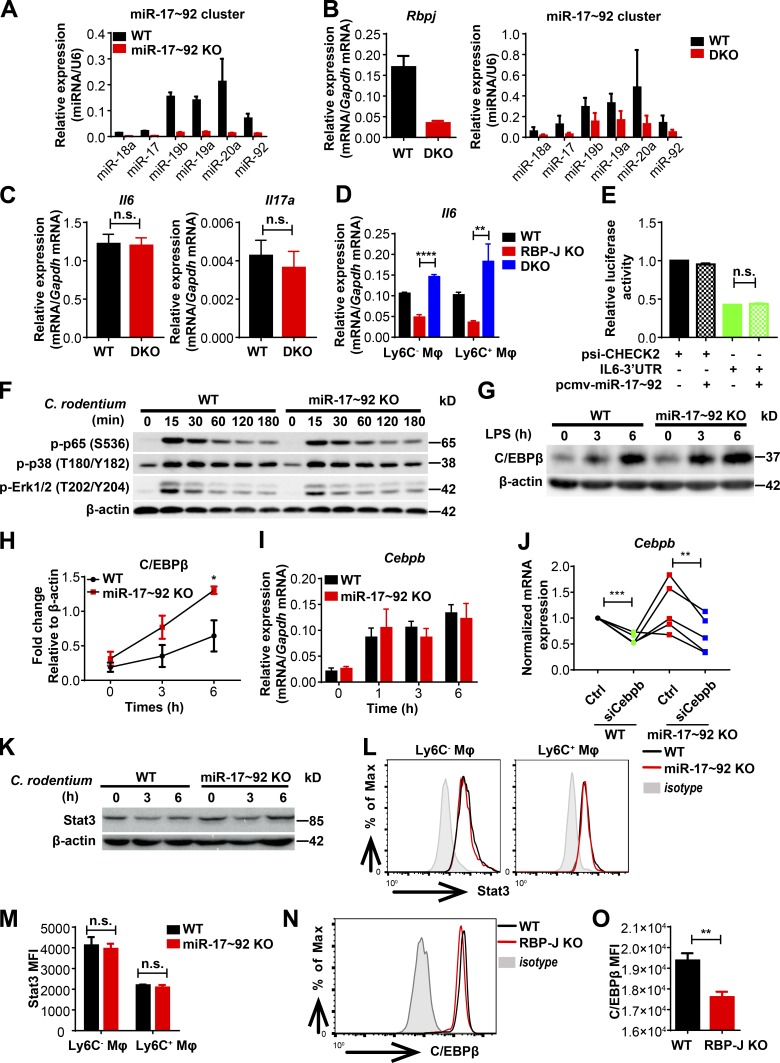
Figure S4.
RBP-J promotes IL-6 production by inhibition of the miR-17∼92–C/EBPβ axis. (A) qPCR analysis of the miR-17∼92 cluster in WT (Lyz2-Cre) and miR-17∼92 KO (miR-17∼92fl/fl Lyz2-Cre) BMDMs. (B) qPCR analysis of Rbpj mRNA and the miR-17∼92 cluster in WT (Lyz2-Cre) and DKO (Rbpjfl/fl miR-17∼92fl/fl Lyz2-Cre) BMDMs. (C) WT and DKO mice were orally inoculated with 2 × 10⁹ CFUs of C. rodentium. qPCR analysis of Il6 (left) and Il17a (right) in LP mononuclear cells at day 7 p.i. Data are pooled from two independent experiments; n = 3 in each group. (D) qPCR analysis of Il6 in sorted LP colonic macrophage subsets from WT, RBP-J KO, and DKO mice at day 5 p.i. Data are pooled from two independent experiments; n = 3 in each group. (E) A luciferase reporter plasmid (psi-CHECK2) containing the IL-6 3′ UTR and an expression plasmid encoding miR-17∼92 cluster (pCMV-miR-17∼92) were cotransfected into HEK293T cells. Luciferase activities were determined and normalized to the condition with empty reporter plasmid alone. Data are pooled from two independent experiments. (F) Immunoblotting analysis of the indicated proteins in whole-cell lysates of BMDMs treated with heat-killed C. rodentium (MOI = 0.5) for various times (top lanes). (G and H) Immunoblotting analysis of C/EBPβ protein in whole-cell lysates of BMDMs treated with LPS (10 ng/ml). Data from one representative experiment (G) and densitometrical quantitation of cumulative data from three independent experiments (H) are shown. (I) qPCR analysis of Cebpb mRNA in BMDMs stimulated with heat-killed C. rodentium (MOI = 0.5). Data are pooled from three independent experiments. (J) qPCR analysis of Cebpb in BMDMs transfected with siCebpb or control siRNA. Data are pooled from three independent experiments. (K) Immunoblotting analysis of Stat3 in whole-cell lysates of BMDMs treated with heat-killed C. rodentium (MOI = 0.5) for various times (top lanes). (L and M) Representative FACS plots (L) and cumulative mean fluorescence intensity (MFI; M) of Stat3 expression in WT and miR-17∼92 KO colonic macrophages at day 5 p.i. Black lines represent WT mice, red lines represent miR-17∼92 KO mice, and shaded curves represent isotype control. Data are pooled from two independent experiments; n ≥ 3 in each group. (N and O) Representative FACS plots (N) and cumulative MFI (O) of C/EBPβ expression in WT and RBP-J KO colonic macrophages. Black lines represent WT mice, red lines represent RBP-J KO mice, and shaded curves represent isotype control. Data are pooled from two independent experiments; n = 3 in each group. Data are shown as mean ± SEM; n.s., not significant; *, P < 0.05; **, P < 0.01; ****, P < 0.0001; two-tailed Student’s paired t test (J) or two-tailed Student’s unpaired t test (other panels).

