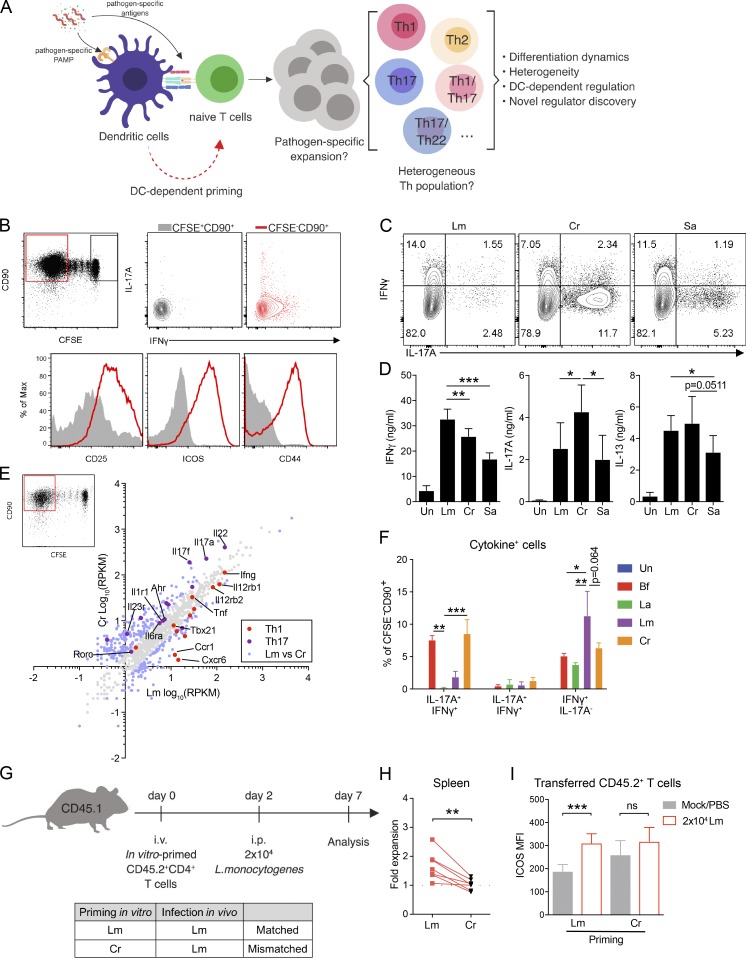
Figure 1.
Validation of an in vitro–priming approach to generate functional pathogen-specific Th cells. (A) Schematic overview of the priming system and workflow. (B) Top row: Representative CFSE dilution graph and cytokine (IFNγ and IL-17A) staining from CFSE+ and CFSE− populations. Bottom row: Histogram of CD25, CD44, and ICOS from CFSE+ and CFSE− populations. Cells were cocultured for 10–12 d before analysis. (C) Representative intracellular cytokine staining of IFNγ- and IL-17A–producing Th cells following priming by CD11c+ DCs stimulated with Lm, Cr, or Sa lysates. (D) Secreted protein levels of IFNγ, IL-17A, and IL-13 in the supernatants of cocultures as in C, measured by ELISA. n = 5. Un, unstimulated. (E) Scatter plot of mRNA expression values (log10[reads per kilobase of transcript per million mapped reads/RPKM]) obtained from RNA-seq of Lm- or Cr-specific CFSE− Th cells. Data were averaged from two independent samples. Blue data points indicate differentially expressed genes (fold change ≥2). (F) Percentages of IFNγ- and IL-17A–producing cells in pathogen- or commensal-specific Th cells. Naive WT CD4 T cells were primed by DCs stimulated with heat-killed commensal bacteria Bf, La (multiplicity of infection [MOI] = 3) or 10 µg/ml Lm/Cr lysate. Intracellular cytokine was examined at day 10. n = 2–4. (G) Experimental design for testing in vivo specificity (top) and the mismatch scheme (bottom). (H) Expansion of transferred (in vitro primed with Lm or Cr) CD4 T cells in the spleen at day 5 after infection of Lm (shown as fold change comparing CD45.2+ percentage of infected mouse to paired PBS control). n = 7 mice per group. (I) Mean fluorescence intensity (MFI) of surface ICOS on donor CD45.2+ T cells from the same experiment as G and H. n = 7 mice per group. Data are representative or combined from two to five independent experiments. All plots are pregated on live cells. Error bars represent mean ± SEM, and P values were determined by paired Student’s t test (D, H, and I) or two-way ANOVA with Tukey correction (F). ns, not significant; *, P < 0.05; **, P < 0.01; ***, P < 0.001.

