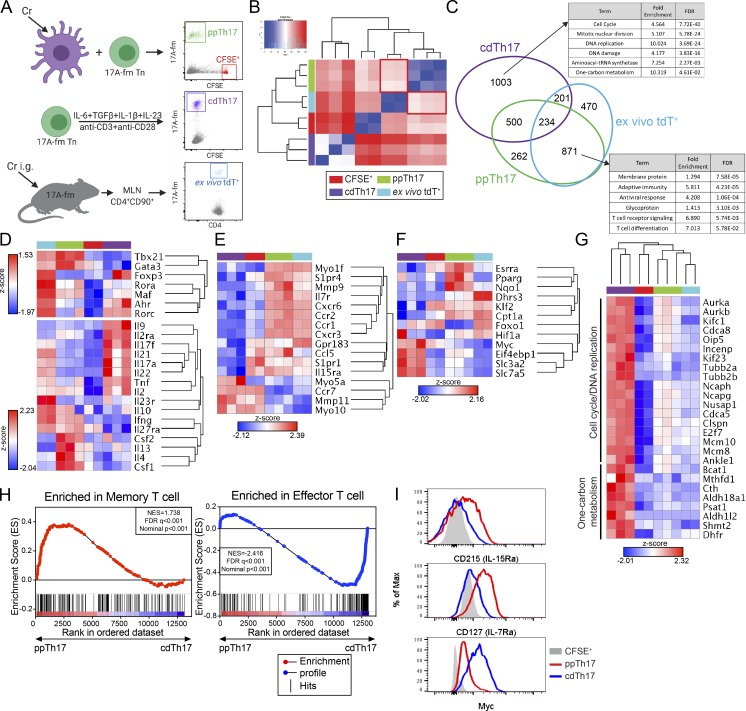
Figure 2.
Comparative transcriptional analysis reveals major divergence in programming between ppTh17 and cdTh17 cells. (A) Experimental design for transcriptional profiling of CFSE+ (naive), ppTh17 (Cr-specific, day 12), cdTh17 (day 5), or ex vivo tdT+ cells (10 dpi/peak of infection with 5 × 10⁸ CFU of Cr). (B) Euclidean distance between global gene expression in naive CFSE+, ppTh17, cdTh17, or ex vivo tdT+ cells. CFSE+ and ex vivo tdT+, n = 2; ppTh17 and cdTh17, n = 3. (C) Number of genes shared or uniquely expressed by indicated three Th17 populations (compared with CFSE+ naive T cells) and their functional annotation enrichment analyzed by DAVID. FDR, false discovery rate. (D) Heatmap and hierarchical analysis of key T cell TFs, cytokines, and cytokine receptor expression from transcriptional profiling described in A. (E) Heatmap and hierarchical analysis of gene expression for gene cluster involved in in vivo T cell motility, migration, chemokine and chemokine receptor signaling, T cell positioning, and antigen sampling. (F) Heatmap and hierarchical analysis of gene expression for genes involved in metabolic processes. (G) Heatmaps of genes representing cell cycle/DNA-replication pathways and amino acid metabolism pathways. (H) GSEA analysis of ppTh17 and cdTh17 cells compared with Molecular Signature dataset of effector versus memory T cells. (I) Flow cytometry analysis of CD127 (IL-7Rα), CD215 (IL-15Rα), and c-Myc in ppTh17 and cdTh17 cells. Data are representative or combined from two to three independent experiments. In heatmaps, each row/column represents one independent sample. Hierarchical clustering was determined by Euclidean distance and pairwise average-linkage (B and D–G). Heatmap represents global expression z-score.

