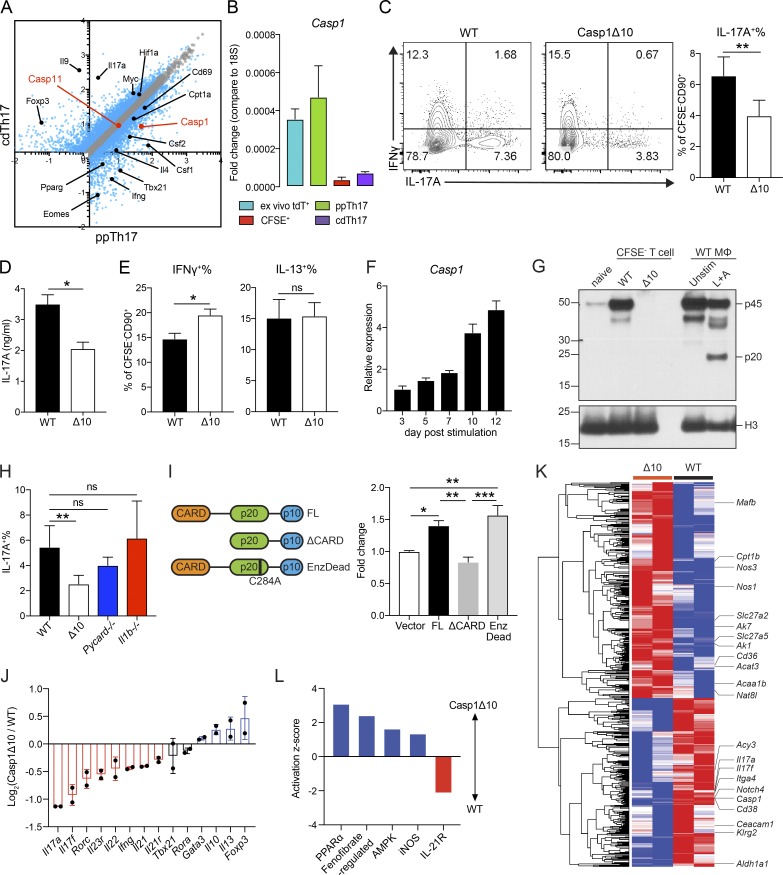
Figure 3.
Caspase-1 promotes the differentiation of Th17 lineage independent of its enzymatic activity or inflammasome activation. (A) Differentially expressed transcripts between ppTh17 and cdTh17 cells. Each dot represents the average of three independent experiments. Blue dots indicate differentially regulated genes (fold change >1.5, false discovery rate <0.05). Black dots indicate differentially regulated transcripts described in Fig. 2. Red dots indicate Casp1 and Casp11 transcripts. (B) mRNA expression of Casp1 relative to 18s rRNA in sorted naive (CFSE+), ppTh17, cdTh17, or ex vivo tdT+ cells from mLNs of Cr-infected 17A-fm mice (10 dpi), quantified by independent qRT-PCR experiments. n = 2. (C) Naive CD4 T cells from WT or Casp1Δ10 (Δ10) mice were primed in vitro by Cr lysate–stimulated WT splenic CD11c+ DCs, and IL-17A– and IFNγ-producing cells were measured by intracellular cytokine staining and flow cytometry analysis of CD90+CFSE− live CD4 T cells (left); IL-17A+ percentages were quantified (right). n = 7. (D) IL-17A in the supernatant from experiments in C, measured by ELISA. n = 3. Δ10, Casp1Δ10. (E) IFNγ+ and IL-13+ percentage of CD90+CFSE− live cells, quantified from experiments in C. n = 7. Δ10, Casp1Δ10. (F) Relative expression (normalized to 18s rRNA and relative to day 3) of Casp1 mRNA at indicated time points after Cr-priming. n = 4. (G) Western blot analysis of procaspase-1 (p45) and cleaved caspase-1 (p20) from naive CD4 T cells, sorted CD90+CFSE− Cr-primed Th cells, or WT bone marrow–derived macrophages (MΦ) that were unstimulated or under conventional inflammasome activation (4 h LPS + 30 min ATP [L+A]). (H) Naive WT, Casp1Δ10 (Δ10), Pycard−/−, Il1b−/− CD4 T cells were primed with Cr-stimulated WT DCs. IL-17A+ percentage of CFSE−CD90+ live cells was measured by intracellular cytokine staining and quantified. n = 5. (I) Casp1Δ10 CD4 T cells were differentiated to Th17 lineage and retrovirally reconstituted with MSCV-IRES-hCD2 alone (Vector), full-length Casp1 (FL), Casp1 deficient of CARD (Casp1ΔCARD), or enzymatically (Enz) inactive form of Casp1 (EnzDead, C284A) and quantified for IL-17A+ percentage (gated on live, hCD2+ population). n = 4. (J) Log2(fold change) of major Th cell cytokine and TF expression comparing WT and Casp1Δ10 Cr-specific Th cells. WT or Casp1Δ10 naive CD4 T cells were primed with Cr-stimulated WT DCs for 10 d. CFSE−CD90+ population was FACS-sorted and subjected to mRNA-seq and analysis. n = 2. (K) Heatmap and hierarchical clustering of differentially expressed (>1.5 fold) genes comparing WT and Casp1Δ10 (Δ10) Cr-specific Th cells. Genes of interest were labeled by the heatmap. Each column represents one independent replicate. (L) Activation z-score of pathways enriched in WT or Casp1Δ10 Cr-specific Th cells. Pathway analysis was performed using Ingenuity Pathway Analysis. Data are representative of or combined from two to seven independent experiments. Statistics represent mean ± SEM, and P values were determined by paired Student’s t test (C–E and H) or one-way ANOVA with Tukey correction (I). ns, not significant; *, P < 0.05; **, P < 0.01; ***, P < 0.001.

