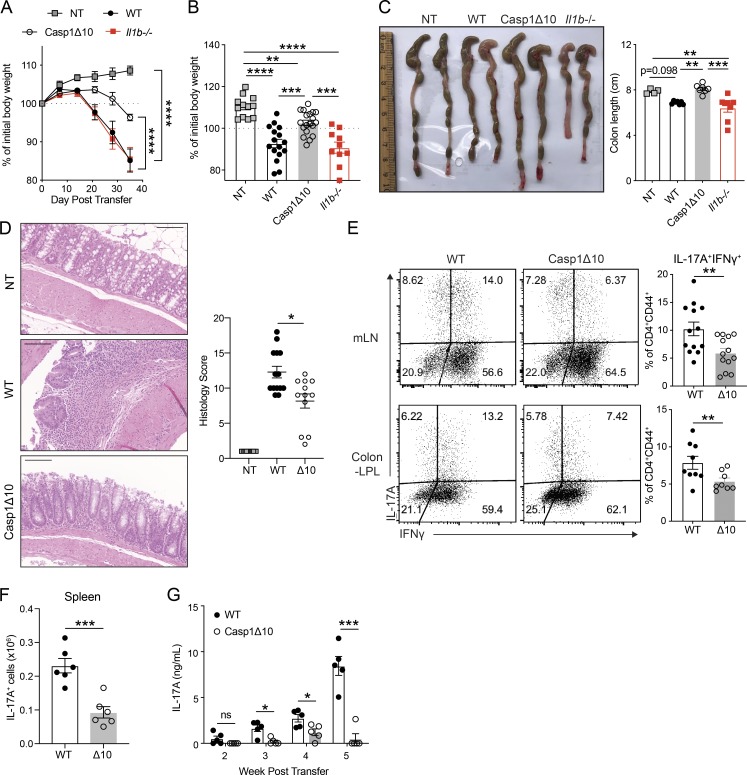
Figure 5.
T cell–intrinsic caspase-1 is required for Th17-mediated colitis. (A) Weight change of Rag1−/− mice that received WT, Casp1Δ10, or Il1b−/− naive CD4 T cells (CD45RBhi) at indicated time points (n = 6–10 mice for each group). NT, nontransferred (i.p. PBS). (B) Percentage of initial body weight 4 wk after transfer. n = 12–19 mice per group. (C) Representative image of colons (left) and measured colon length (right) of Rag1−/− mice at 4–5 wk after transfer. n = 4–8 mice per group. (D) Representative H&E staining of colon sections from NT, WT, or Casp1Δ10 (Δ10) naive T cell–transferred Rag1−/− mice (left) and histology score (right). Images are displayed at 20× magnification. Ruler bar represents 100 µm. n = 12–14 mice per group. (E) Representative flow plots showing the percentages of IL-17A+IFNγ+ of CD4+CD90+CD44+ T cells in the mLNs or colonic LP (Colon-LPL) of Rag1−/− mice 4 wk after transfer of WT or Casp1Δ10 (Δ10) naive CD4 T cells. n = 8–13 mice per group. (F) The number of CD4+CD90+IL-17A+ T cells in the spleens of the Rag1−/− mice that received WT or Casp1Δ10 (Δ10) naive CD4 T cells. n = 6 per group. (G) Serum IL-17A levels at the indicated time points from the mice in Fig. 5 F. n = 5 mice per group. Data are representative of or combined from two to four independent experiments. Each data point represents one biological replicate. Statistics represent mean ± SEM and P values were determined by two-way repeated ANOVA with Bonferroni correction (A), one-way ANOVA (B and C), Mann-Whitney U test (D), unpaired Student’s t test (E and F) or multiple t tests with Holm-Sidak correction (G). *, P < 0.05; **, P < 0.01; ***, P < 0.001; ****, P < 0.0001.

