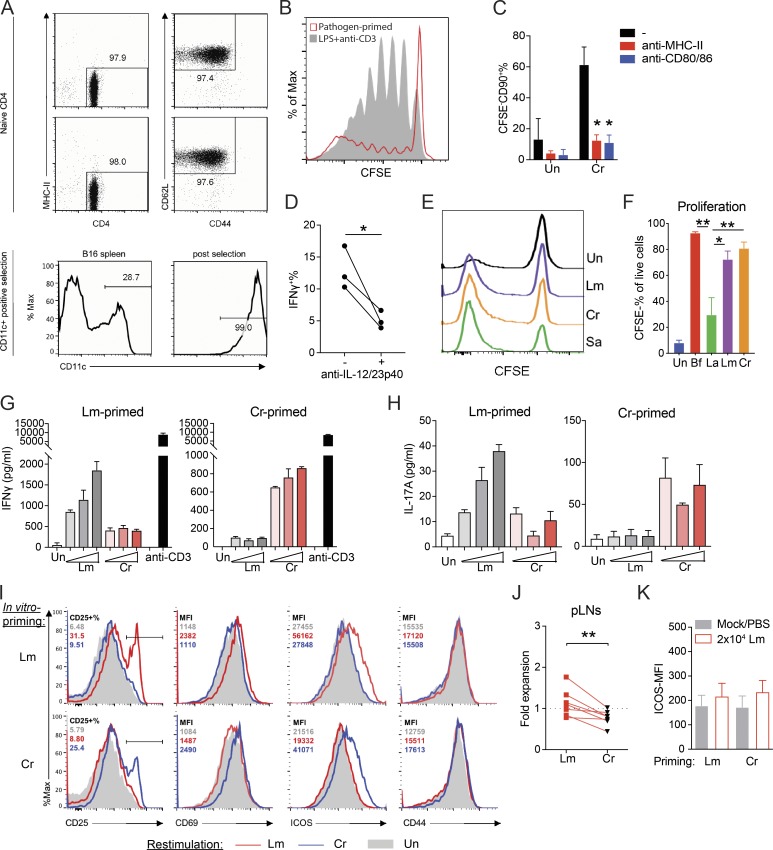
Figure S1.
An in vitro priming approach to generate functional pathogen-specific Th cells. (A) Top: Purity of isolated naive CD4 T cells (CD4+MHCII−CD62L+CD44−) from two independent experiments. Bottom: Purity of CD11c+ DCs before or after isolation. (B) Overlay histograms of CFSE dilution curves from naive CD4 T cells primed with Cr-stimulated DCs (pathogen primed) or LPS stimulated DC + TCR ligation (LPS + anti-CD3). (C) CFSE−CD90+ percentage in Cr-primed CD4 T cells where 10 µg/ml blocking antibodies to mouse IA/IE (MHCII) or CD80/CD86 were added to the coculture. n = 2–3. (D) IFNγ+ percentage of Cr-primed CFSE−CD90+ T cells in the presence or absence of anti–IL-12p40 antibodies during differentiation. n = 3. (E) Proliferation of T cells in the priming system with the indicated pathogens, shown by CFSE dilution. Un, unstimulated. (F) Proliferation of pathogen- or commensal-specific T cells primed by DCs stimulated with heat-killed commensal bacteria Bf, La (MOI = 3), or 10 µg/ml Lm/Cr lysate. n = 2–3. (G and H) IFNγ (G) and IL-17A (H) quantities in the culture supernatant of CD4 T cells previously primed with Lm (left) or Cr (right) that were restimulated for 48 h with unstimulated (Un) or Lm/Cr-fed, irradiated B cells. Lm and Cr concentrations used for restimulation were titrated at 3, 10, and 30 µg/ml. Culture supernatants from anti-CD3 (30 ng/ml)-stimulated T cells were also assessed for IFNγ production as a positive control. n = 2 technical replicates. Data are representative of three independent experiments. (I) Histogram showing CD25+ percentage or mean fluorescence intensity (MFI) of CD69, ICOS, and CD44 (percentage and MFI shown on upper left corner) on the CD90+ T cells from the same experiments in G and H denoting up-regulation of indicated activation markers in response to Lm/Cr rechallenge. Lysate concentration = 10 µg/ml. (J) Quantified fold expansion of transferred (in vitro–primed with Lm or Cr) T cells (CD45.2+) in the peripheral lymph nodes (pLNs) of mice from the same experiments shown in Fig. 1 G. n = 7 mice per group. (K) Quantified MFI of surface ICOS on recipient endogenous CD45.1+ T cells from the same experiments shown in Fig. 1 G. n = 7 mice per group. Data are pooled from or representative of two to four independent experiments. Statistics represent mean ± SEM, and P values were determined by repeated-measures two-way ANOVA with Tukey correction (C), one-way ANOVA with Tukey correction (F), or paired Student’s t test (D and J). *, P < 0.05; **, P < 0.01.

