Figure S3.
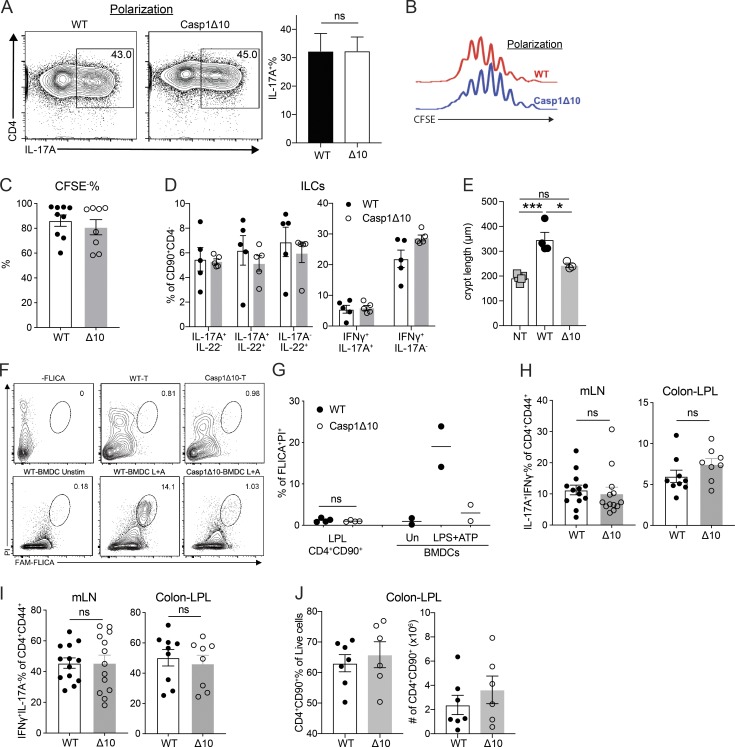
T cell–intrinsic caspase-1 is required for host protection and Th17-mediated autoinflammatory disease. (A) Naive CD4 T cells from WT or Casp1Δ10 (Δ10) mice were isolated and polarized to cdTh17 cells. Representative flow cytometry plot (left) and quantifications of IL-17A+ percentage (right) are shown. n = 4. (B) Representative histogram overlay of CFSE dilution from experiments in A. (C) CFSE− percentage of transferred CD4 T cells, examined at 10 dpi. n = 8–9 mice per group. Δ10, Casp1Δ10. (D) Percentage of cytokine-positive cells in CD90+CD4− population (ILCs) from the same experiments in Fig. 4. n = 5 mice per group. (E) Colonic crypt length measured from histology images in Fig. 5 D. n = 3–5 mice per group. NT, nontransferred (i.p. PBS). Δ10, Casp1Δ10. (F and G) WT and Casp1Δ10 CD45RBhi CD4 cells were transferred to Rag1−/− mice. 3 wk after transfer, LPL cells were isolated and stained with FAM-FLICA to detect activation of caspase-1. FLICA+PI+ indicates inflammasome-activated cells. WT and Casp1Δ10 bone marrow–derived DCs (BMDCs) that were treated with inflammasome-activating ligands (4 h LPS [100 ng/ml] and 30-min 5 mM ATP) were used as positive and negative controls for FLICA staining. Representative flow plot is shown in F and quantified in G; n = 2–4/group. (H and I) IL-17A+IFNγ− percentage (H) and IFNγ+IL-17A− percentage (I) of CD4+CD90+CD44+ T cells in the mLN or colonic LP (Colon-LPL) of Rag1−/− mice 4 wk after transfer of WT or Casp1Δ10 naive CD4 T cells. n = 8–13 mice per group. (J) Percentages and numbers of CD4+CD90+ T cells from Colon-LPL of Rag1−/− mice 4 wk after transfer of WT or Casp1Δ10 naive CD4 T cells. n = 6–7 mice per group. Data are representative of or pooled from two to four independent experiments. Statistics represent mean ± SEM, and P values were determined by paired Student’s t test (A), one-way ANOVA with Tukey correction (E), or unpaired Student’s t test (G–I). ns, not significant; *, P < 0.05; ***, P < 0.001.

