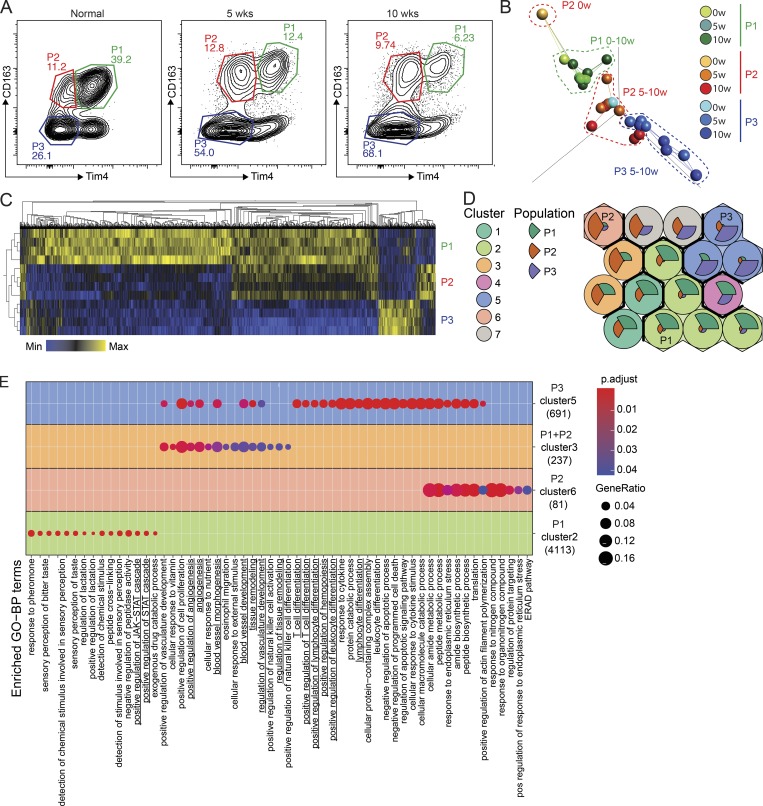
Figure 5.
CD163+ Tim4+ tissue-resident macrophages express a unique transcriptional profile. (A) Gating strategy for cell sorting of P1, P2, and P3 populations of omental macrophages from naive (n = 2) and tumor-bearing mice at 5 and 10 wk after injection of ID8 cells (n = 4). 500 cells were sorted for each population and subjected to bulk RNAseq analysis. (B) PCA and network analysis of variable gene expression in P1, P2, and P3 macrophages. PCA analysis was performed on normalized data (mean = 0, and variance = 1), generating a correlation-based PCA plot. Network analysis connects k nearest neighbors (k = 3) based on similarity calculated by Pearson correlation. (C) Heatmap showing hierarchical clustering of the 5,000 most DEGs for each of the three populations at 10 wk of tumor growth. DEGs were identified by pairwise comparison with a cut-off of Padjusted > 0.01. (D) SOMs of identified DEGs using the Kohonen package for R. The SOM analysis found 16 single SOMs that were subsequently grouped by hierarchical clustering to identify population-specific clusters (clusters 1–7). The magnitude of the pie slices indicates the relative proportions of genes enriched in P1 (green), P2 (brown), and P3 (blue) within the SOM. (E) ClusterProfiler enrichment analysis against the GO database on SOM clusters 1–7. Only clusters with significantly enriched pathways are visualized. Libraries were prepared from two independent experiments with n = 2 and sequenced on the same flow cell for a total of four biological replicates. ERAD, endoplasmic reticulum–associated protein degradation; pos, positive.

