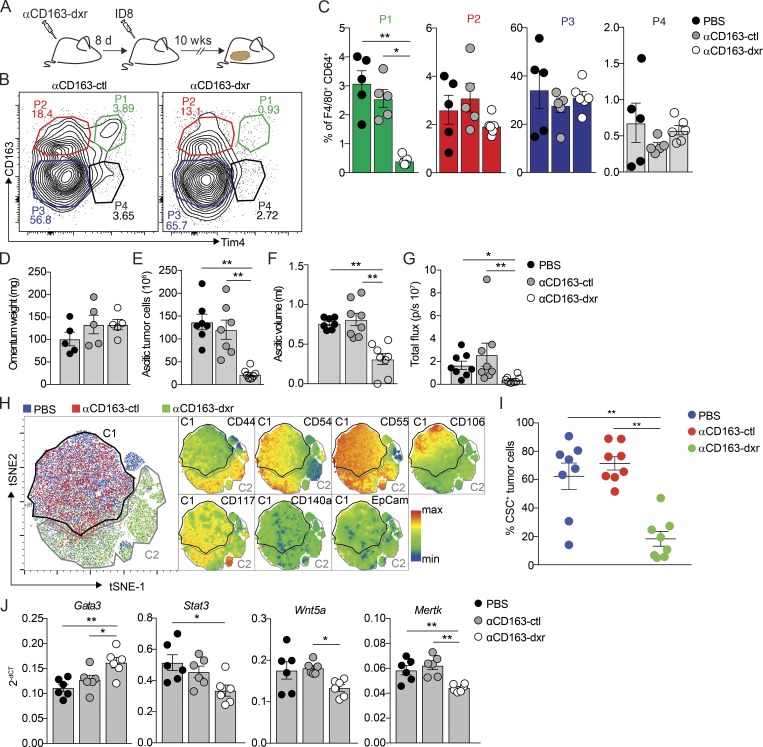
Figure 8.
CD163+ Tim4+ tissue-resident macrophages promote the CSC-like phenotype of ovarian cancer cells. (A) Specific depletion of CD163+ Tim4+ (P4) macrophages using dxr-loaded αCD163-LNPs (αCD163-dxr); mice were injected i.p. with 1 mg/kg αCD163-dxr or controls (empty αCD163-LNPs or PBS) on days 1, 3, and 5, before injection of ID8-Luc cells on day 8. (B and C) Flow cytometry analysis of CD163hi Lyve-1+ macrophages in omentum at 10 wk after prophylactic treatment with αCD163-dxr. Data are represented as mean ± SEM of n = 5 (PBS, αCD163-LNP) or n = 6 (αCD163-dxr), and statistically significant difference was calculated using Kruskal-Wallis one-way ANOVA followed by Dunn’s multiple comparisons test; *, P < 0.05; **, P < 0.01. (D–F) Omentum weight (D), total tumor cells in ascites (E), and ascites volume (F) at 10 wk after prophylactic treatment with αCD163-dxr. (G) Ex vivo bioluminescence analysis of metastases on the diaphragm. Data are represented as mean ± SEM of n = 8, and statistically significant difference was calculated using Kruskal-Wallis one-way ANOVA followed by Dunn’s multiple comparisons test; *, P < 0.05; **, P < 0.01. (H) tSNE map of concatenated fcs files from flow cytometry analysis of tumor cells from ascites after prophylactic treatment with αCD163-dxr. tSNE parameters were computed on expression levels of CSC markers (CD44, CD54, CD55, CD106, CD117, CD140a, and EpCam), and individual sample files were color-coded according to treatment group (PBS, blue; αCD163-ctl, red; αCD163-dxr, green; n = 8). This analysis identified distinct clusters from control-treated mice (PBS or αCD163-LNP; C1, black) and αCD163-dxr–treated mice (C2, gray). Expression of the individual CSC markers was subsequently visualized by heatmap statistics in a tSNE map of the concatenated samples within C1 (PBS or αCD163-LNP) and C2 (αCD163-dxr; right). (I) Flow cytometry analysis identifying the proportion of malignant cells expressing specific CSC markers: CD54, CD55, CD106, and CD117. See Fig. S5 G for the gating strategy. Data are represented as mean ± SEM of n = 8, and statistically significant difference was calculated using Kruskal-Wallis one-way ANOVA followed by Dunn’s multiple comparisons test; **, P < 0.01. (J) Gene expression analysis of Gata3, Stat3, Wnt5a, and Mertk in tumor cells from omentum after specific depletion of CD163+ Tim4+ (P1) macrophages, as described in A. dCT, delta cycle threshold. Data are represented as mean ± SEM of n = 6, and statistically significant difference was calculated using Kruskal-Wallis one-way ANOVA followed by Dunn’s multiple comparisons test; *, P < 0.05; **, P < 0.01. A–G are representative of three independent experiments, whereas H–J are representative of two independent experiments.

