Figure S2.
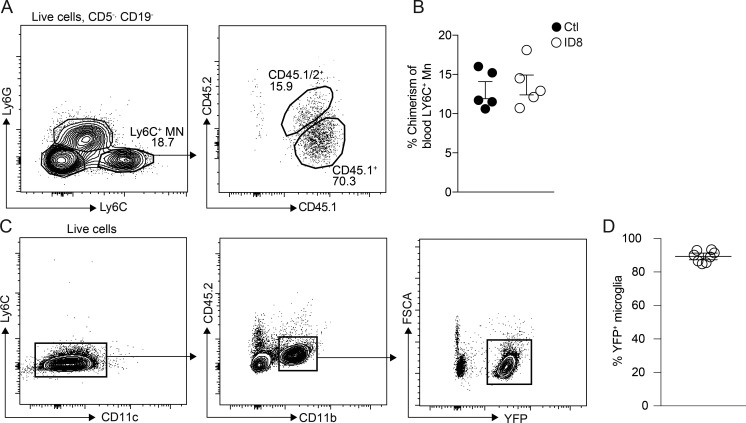
Fate mapping of omental macrophages. (A and B) Flow cytometric analysis of blood monocytes in mice 5 wk (A) or 13 wk (B) after adoptive transfer of CD45.1+/CD45.2+ donor bone marrow in irradiated CD45.1+ host mice that were protected by a lead shield. Monocytes were gated as Live (FSC-A versus Sytox Blue), CD5neg, CD19neg (CD5 versus CD19), NK1.1neg, CD11b+ (CD11b versus NK1.1), and Ly6C+, Ly6Gneg (Ly6C versus Ly6G). Data are represented as mean ± SEM of n = 5. (C) Flow cytometric analysis of YFP+ microglia in Cx3Cr1CreER:R26-yfp mice pulse-labeled with tamoxifen at E16.5. Microglia were gated as Live (FSC-A versus Sytox Blue), Ly6Cneg, CD11cneg (Ly6C versus CD11c), and CD45.2dim, CD11bhi (CD11b versus CD45.2). Data are represented as mean ± SEM of n = 6. All data are representative of two independent experiments.

