Figure 2.
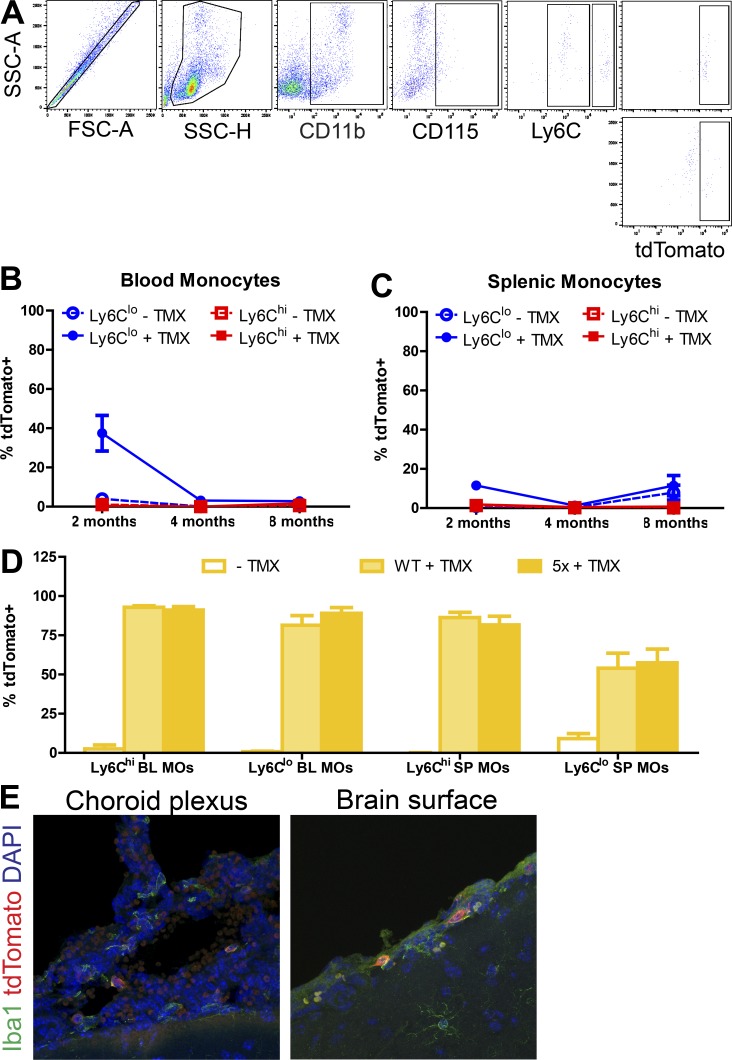
Labeling of peripheral monocyte populations following tamoxifen exposure. (A) Representative flow sorting scheme for tdTomato expression in Ly6Chi and Ly6Clo monocytes from the spleen. FSC, forward scatter; SSC, side scatter. (B and C) Fraction of Ly6Chi and Ly6Clo monocytes in the blood (B) or spleen (C) expressing tdTomato in Cx3cr1CreERT2; ROSA26tdTomato mice at 2, 4, or 8 mo of age following tamoxifen or control injections at 1 mo of age. Data presented as mean ± SEM from five or more mice/age/treatment from three or more independent experiments. (D) Fraction of Ly6Chi and Ly6Clo monocytes expressing tdTomato in Ccr2CreERT2; ROSA26tdTomato mice. Data presented as mean ± SEM from ≥15 mice/age/treatment from ≥3 independent experiments. TMX, tamoxifen. (E) Representative confocal images of IHC for Iba1 and tdTomato in the choroid plexus and on the brain surface in 8-mo-old Ccr2CreERT2; 5xFAD; ROSA26tdTomato mice treated with tamoxifen for 28 d. Scale bar, 15 µm.

