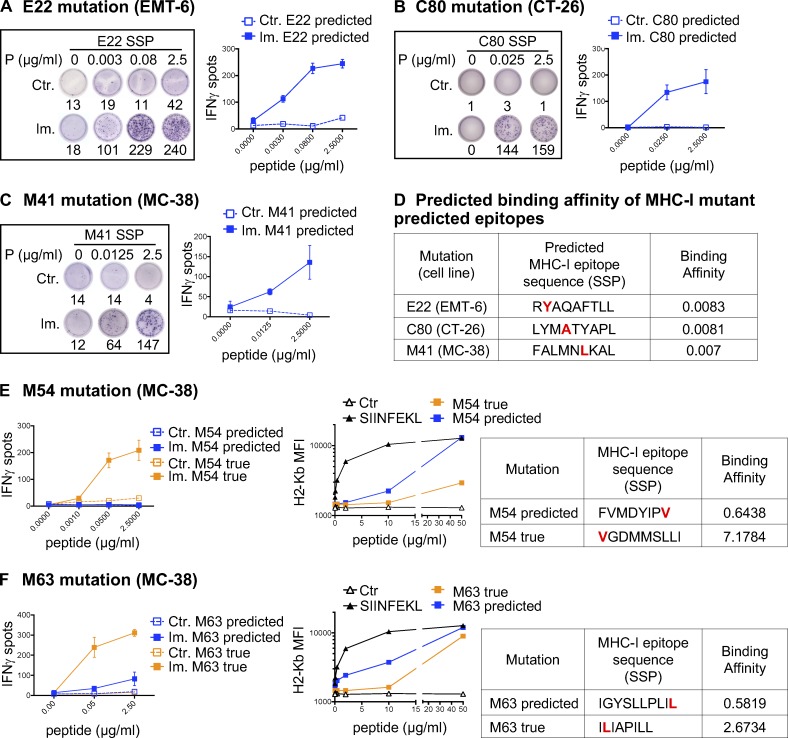
Figure 2.
Validation of MHC-I optimal predicted mutant epitopes. (A–C) Representative pictures of ELISpot wells and mean (± SD) IFN-gamma spot numbers from CD8 T cells (5 × 10⁵ CD4-depleted splenocytes/well) from control (Ctr., n = 1) or immunized (Im., n = 3) mice (in vivo protocol as in Fig. 1 B) after stimulation with the predicted optimal mutant SSPs (A-E22 mutation, EMT-6; B-C80 mutation, CT-26; C-M41 mutation, MC-38). Each image is a representative well from an ELISpot plate. (D) Sequence and BA (percentile rank) of the predicted optimal mutant epitopes in A–C (E22, H-2Kd; C80, H-2Kd; M41, H-2Db). (E and F) Mean (± SD) IFN-gamma spot numbers from CD8 T cells (5 × 10⁵ CD4-depleted splenocytes/well) from control (Ctr., n = 1) or immunized (Im., n = 3) mice (in vivo protocol as in Fig. 1 B) after stimulation with predicted and true mutant optimal epitopes (MC-38; E-M54 mutation; F-M63 mutation). Binding assay of the optimal and true SSPs to H-2Kb on Tap-1 KO EL-4 cells is shown for M54 and M63, as well as the sequence and BA (percentile rank) of the predicted optimal mutant epitopes. Each experiment was performed twice independently.

