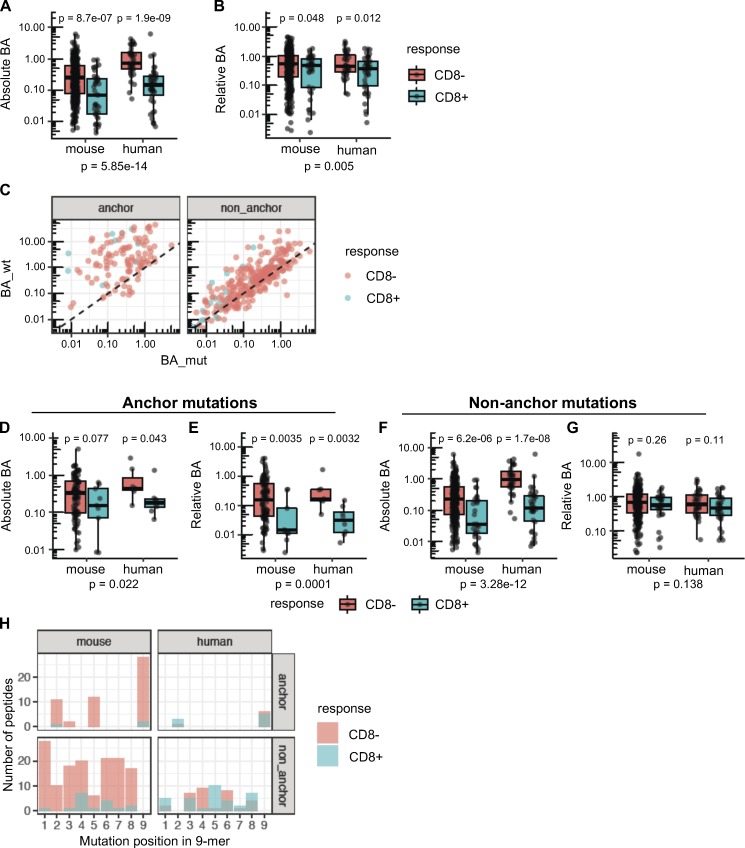
Figure 4.
Position of the mutation determines the importance of absolute or relative affinity for immunogenicity of neoepitopes. (A and B) Absolute BA (A) and relative BA (B) of candidate neoepitopes are shown for the neoantigens that induced CD8 T cell responses (blue) and for the neoantigens that were nonimmunogenic (red). A candidate neoepitope for a given mutation was identified as the peptide that had the best BA value of all 8–11-mer mutant peptides across all MHC-I alleles. P values in the plots are shown based on a t test on log-transformed values. P values in the subtitles are meta-analysis P values calculated using Fisher’s method. No distinction of anchor or nonanchor mutation was made here. Number of data points: 369 (mouse, CD8−), 40 (mouse, CD8+), 39 (human, CD8−), and 42 (human, CD8+). (C) Predicted BA values of mouse candidate neoepitopes and their WT counterparts are shown as scatter plots (Spearman correlation coefficient 0.81 and 0.32 for nonanchor and anchor mutations, respectively). Both anchor and nonanchor mutated peptides contain cases that show CD8 responses. Both anchor and nonanchor scatter plots show significant correlation in predicted BA between the mutant peptides and their WT counterparts (Spearman correlation test P value of 5.16 × 10⁻⁴ and 6.39 × 10−70 for anchor [n = 113] and nonanchor [n = 296] cases, respectively). (D–G) Predicted absolute BA of the neoepitope (D) and the predicted relative BA of the neoepitope to its WT counterpart (E) are shown, specifically for neoepitopes mutated at anchor residues. Number of data points: 104 (mouse, CD8−), 9 (mouse, CD8+), 7 (human, CD8−), and 8 (human, CD8+). Similarly, F and G show the predicted absolute BA and predicted relative BA at nonanchor mutations. Number of data points: 265 (mouse, CD8−), 31 (mouse, CD8+), 32 (human, CD8−) and 34 (human, CD8+). P values in the plots are based on t test, while the P values in the subtitles are meta-analysis P values calculated using Fisher’s method. (H) Number of peptides mutated at each position. Only 9-mer peptides are shown to retain comparability of positions across peptides, as a majority of the predicted neoepitopes were 9-mers. Peptide counts of immunogenic and nonimmunogenic peptides are shown as overlapping bar plots.

