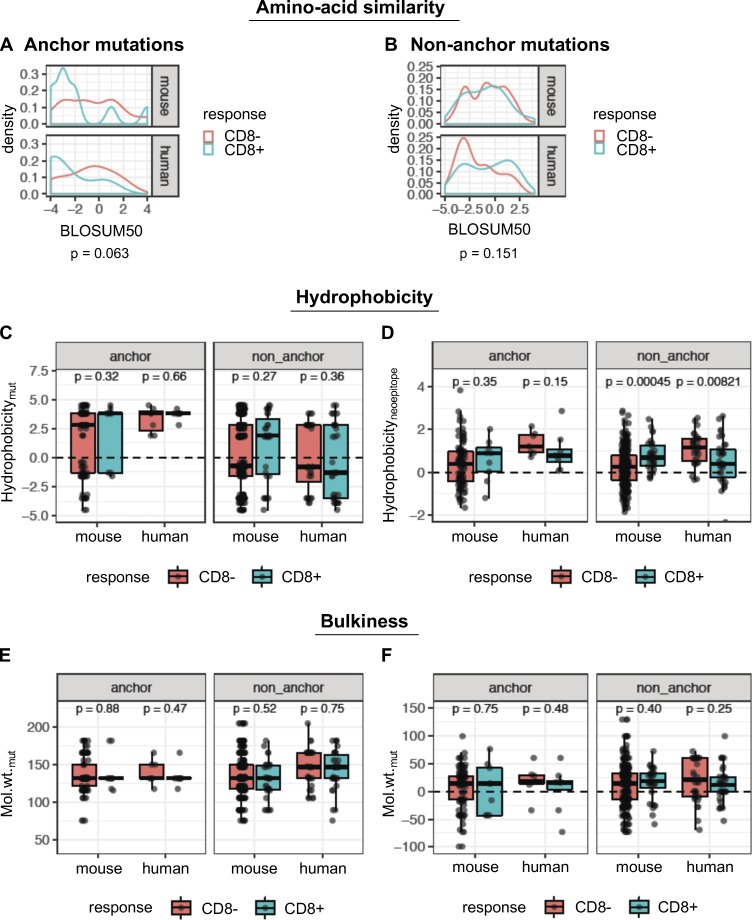
Figure 6.
Physicochemical properties are not consistent predictors of immunogenicity. (A and B) Density plots of distributions of BLOSUM50 scores for the single amino acid substitutions, in immunogenic (blue) or nonimmunogenic (red) neoepitope candidates for anchor (A) and nonanchor (B) mutations. (C) The GRAVY hydrophobicity index of the mutant amino acid of the predicted neoepitope was compared between immunogenic and nonimmunogenic peptides. (D) The mean hydrophobicity index across all amino acids of the predicted neoepitope was also compared. Wilcoxon test was used to compare the hydrophobicity values between immunogenic and nonimmunogenic peptides. (E) Molecular weight of the mutant amino acid is shown for immunogenic and nonimmunogenic predicted neoepitopes. (F) The shift in molecular weight due to mutation is shown for the peptides. Wilcoxon test was used to compare the values between immunogenic and nonimmunogenic peptides. Wilcoxon rank sum test was used to compare the metrics (BLOSUM scores, hydrophobicity, etc.) between immunogenic and nonimmunogenic neoepitope candidates, separately for mouse and human cohorts. Species-specific values from this analysis are shown in the box plots. For the BLOSUM scores, the species-specific P values were combined into a single P value using Fisher’s method. Number of data points for anchor mutations: 104 (mouse, CD8−), 9 (mouse, CD8+), 7 (human, CD8−), and 8 (human, CD8+). Number of data points for nonanchor mutations: 265 (mouse, CD8−), 31 (mouse, CD8+), 32 (human, CD8−), and 34 (human, CD8+).

