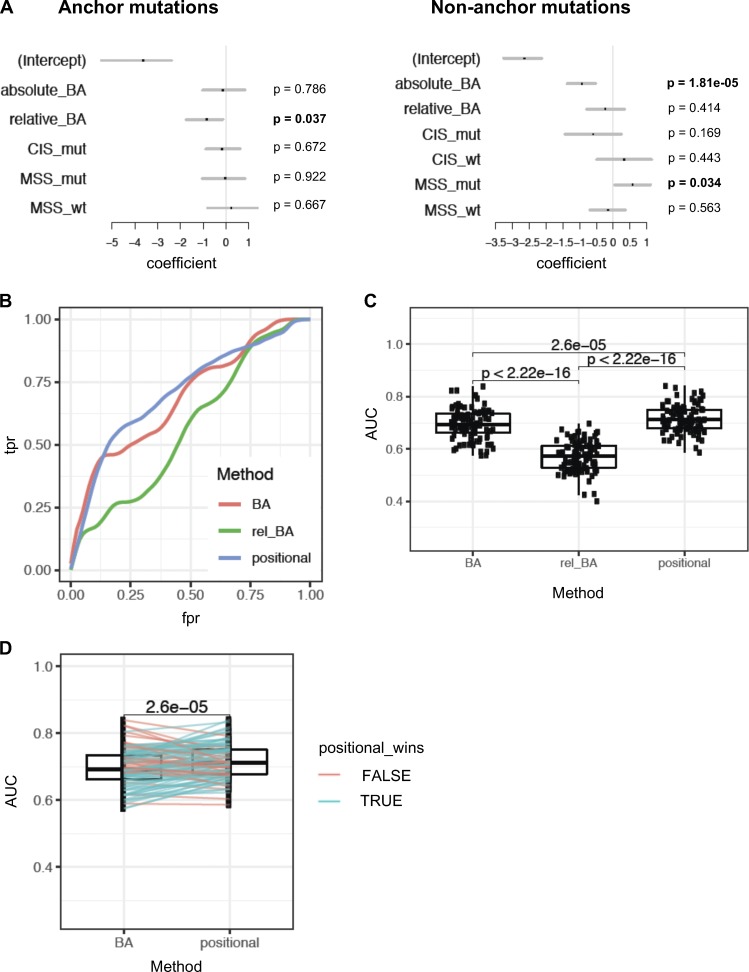
Figure 8.
Positional model ranks neoantigens better than absolute or relative affinity alone. (A) Multivariate models were used to assess the significance of absolute BA of the mutant peptide (absolute_BA), relative affinity (relative_BA), CIS for mutant and WT peptides (CIS_mut and CIS_wt, respectively), and MSS (MSS_mut and MSS_wt). The analysis was done separately for neoepitope candidates with anchor mutations and for those without anchor mutations. Since CIS is identical for the mutant and WT peptides when the mutation is at an anchor, only CIS_mut was considered for the anchor mutation case. The set of these two models is referred to as a positional model. P values are mentioned for each separated model. (B) Performance assessment of the positional model, compared with models that use absolute or relative affinity alone without considering position of mutations with respect to anchor. Receiver-operator characteristic curves (true positive rate vs. false positive rate, or equivalently, sensitivity vs. [1 − specificity]) are shown based on 100 bootstrap iterations. A representative curve is shown for each method, using a Loess fit of 100 bootstrap iterations. (C) AUC of these curves across 100 bootstrap iterations were compared between the three methods (using paired t test). (D) Performance assessment of the positional model relative to predicted absolute BA was assessed by 100 bootstrap iterations. At each iteration, performance of ranking by the positional model and by predicted absolute BA alone was assessed on the held-out data to obtain AUC values. Pairwise comparison of the AUC values from the two methods is shown, and a paired t test was done to assess the difference. Blue lines indicate the iterations where the AUC of the positional model was higher than absolute BA on the held-out data; red lines indicate the cases where it was lower.

