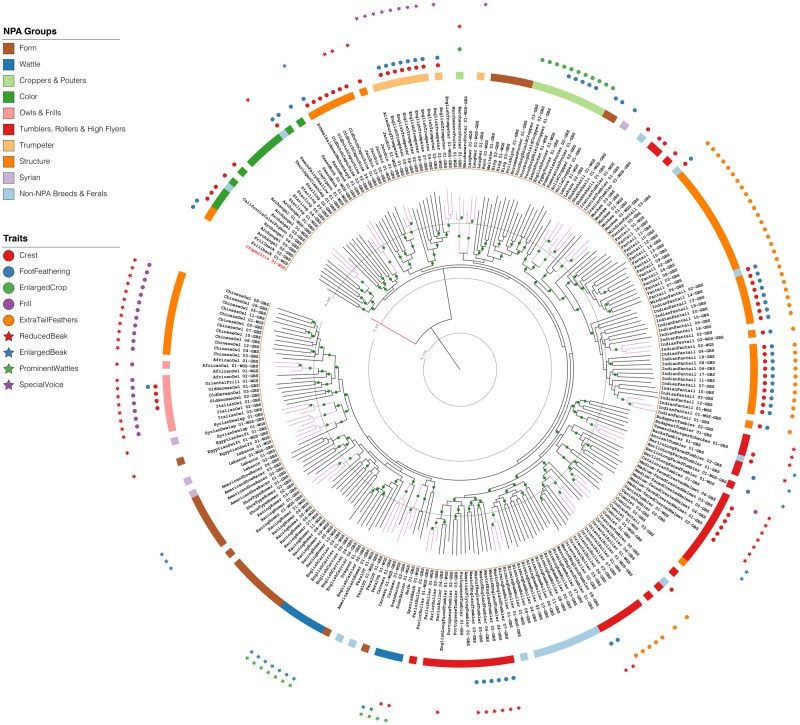
Fig. 2.
—ML phylogeny of pigeon breeds. Phylogenetic reconstruction of the relationships among over 200 pigeon individuals representing 67 breeds and 2 feral pigeons. The outgroup (Columba rupestris) is depicted in red, whereas the 23 triplicates are highlighted in purple. The colored ring depicts the NPA group of each sample, whereas the outermost circles and stars represent the traits present in each breed (information is given just for one sample of each triplicate). Nodes with bootstrap values above 70% are marked with green circles. The inner circular lines represent the inverted scale.

