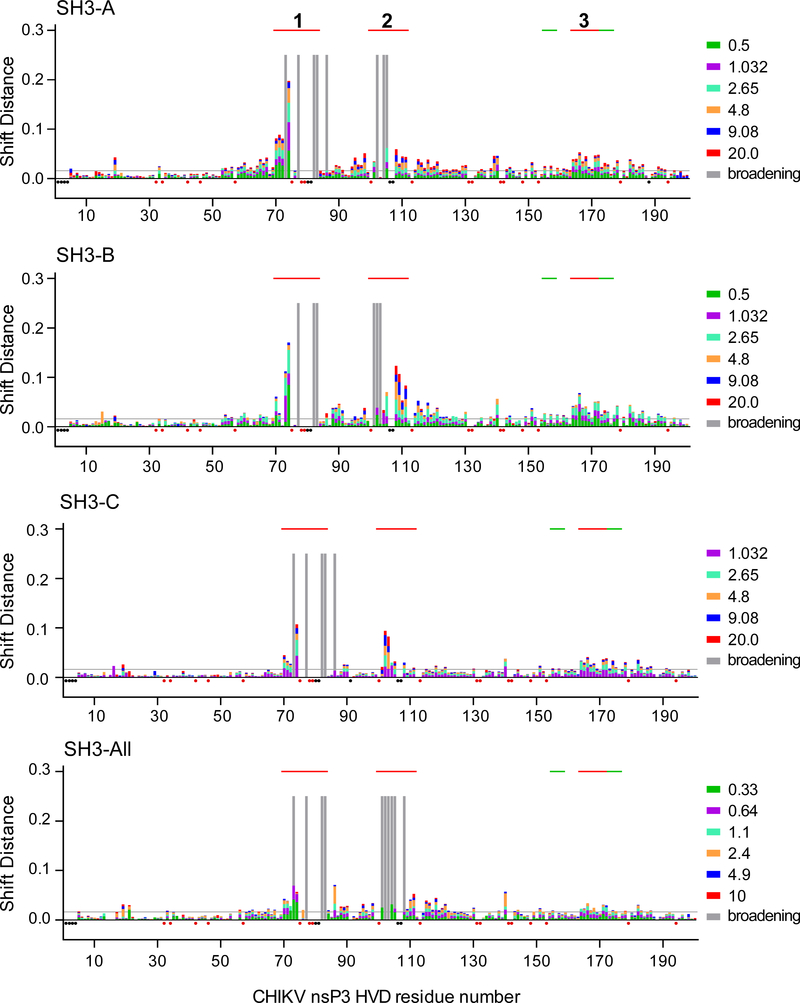
Fig. 3. CHIKV HVD interaction with individual SH3 domains of CD2AP and their combination in SH3-All.
Weighted chemical shift perturbations of the amide bonds (1H and 15N nuclei) in the 15N-labeled CHIKV HVD are presented as superimposed bars on the CHIKV HVD sequence. The lists of the titration ratios (SH3:HVD) are indicated at the right side of the panels. The amino acids that showed broadening of cross peaks during titrations are indicated by grey bars. The unassigned resonances and prolines are indicated by black and red dots, respectively. The thresholds of interacting/non-interacting aa are indicated as grey lines at the level of two standard deviations (2σo). Solid red lines on the tops of the panels indicate the positions of binding sites 1 and 2 and allosteric site 3. The green lines show the positions of G3BP-binding sites.

