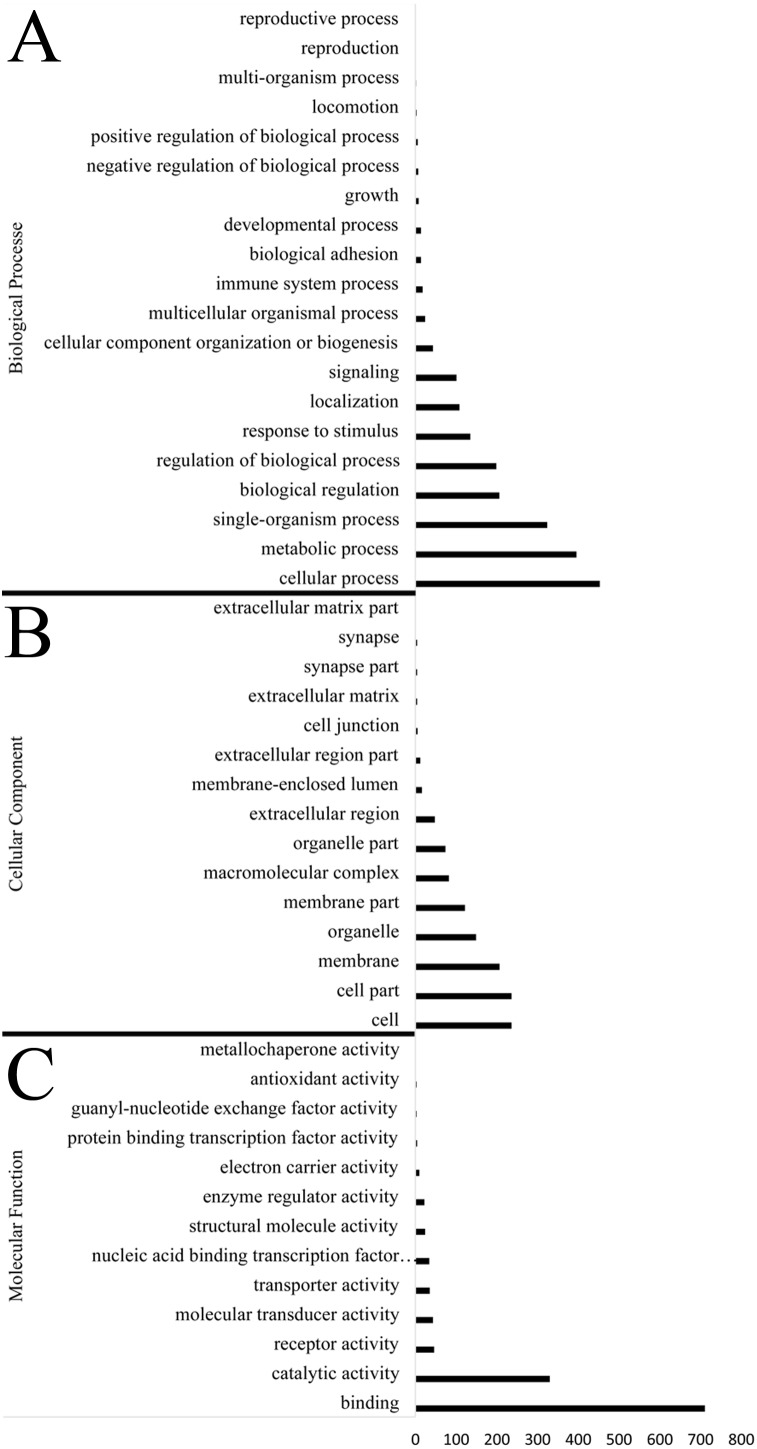
Figure 3. Functional distribution of positively selected genes (PSGs) according to the Gene Ontology (GO) database.
The y axis reveals the GO functional categories, including (A) biological process, (B) cellular component, and (C) molecular function, while the number of genes in each category is plotted on the x axis.

