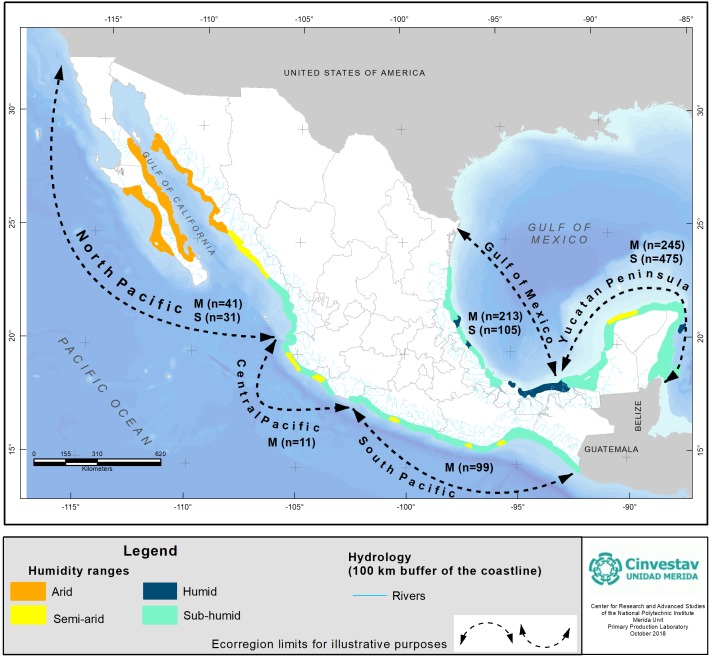
Figure 2. Cartographic representation of climate regions acording to humidity ranges and hydrography of Mexican coastal areas; information of data number (n) for mangrove (M) and seagrass (S) at each region is provided.
Reference data provided by CONABIO (2009). Based on Maderey-R & Torres-Ruata, 1990 for hydrology; and García, 1990 for humidity ranges. Geographic Coordinate System, Datum WGS84.

