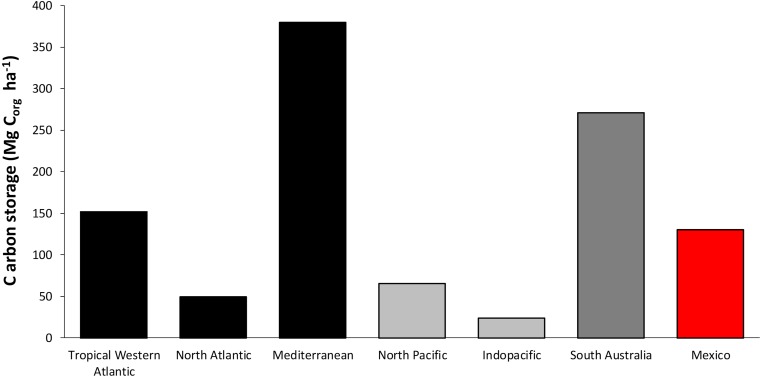
Figure 8. Worldwide average comparison of Corg stocks per unit of area in seagrasses.
Data in Mg per unit of area (ha). Black bars correspond to average data from sites located in the Atlantic sea region (constructed from Fourqurean et al., 2012a; Fourqurean et al., 2012b data); light gray represent data from Pacific Region sites (Fourqurean et al., 2012a; Fourqurean et al., 2012b); dark gray bar represent data from Australia (Fourqurean et al., 2012a; Fourqurean et al., 2012b) and finally, red bar corresponds to Mexico (total result from the addition of above and below ground total averages).

