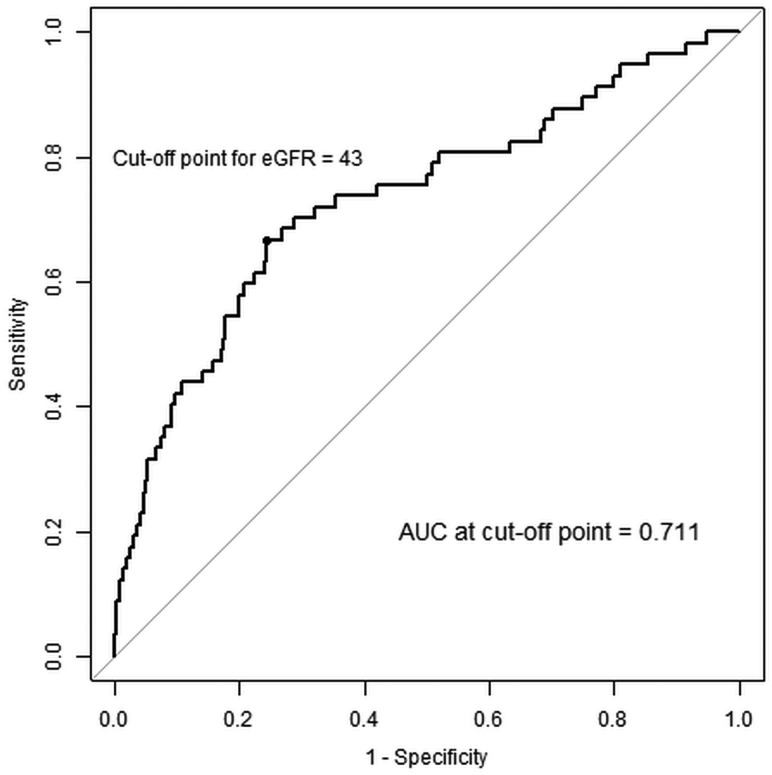
Fig 2.
Receiver operating characteristic (ROC) curves showing the probability of PC-AKI. The ROC curve was drawn for PC-AKI prediction probabilities using significant variables from the multivariate analysis. Baseline eGFR: ROC curve drawn on the basis of the baseline eGFR variables. eGFR is in milliliter/minute/1.73 m2. AUC indicates area under the curve.

