
FIGURE 5.
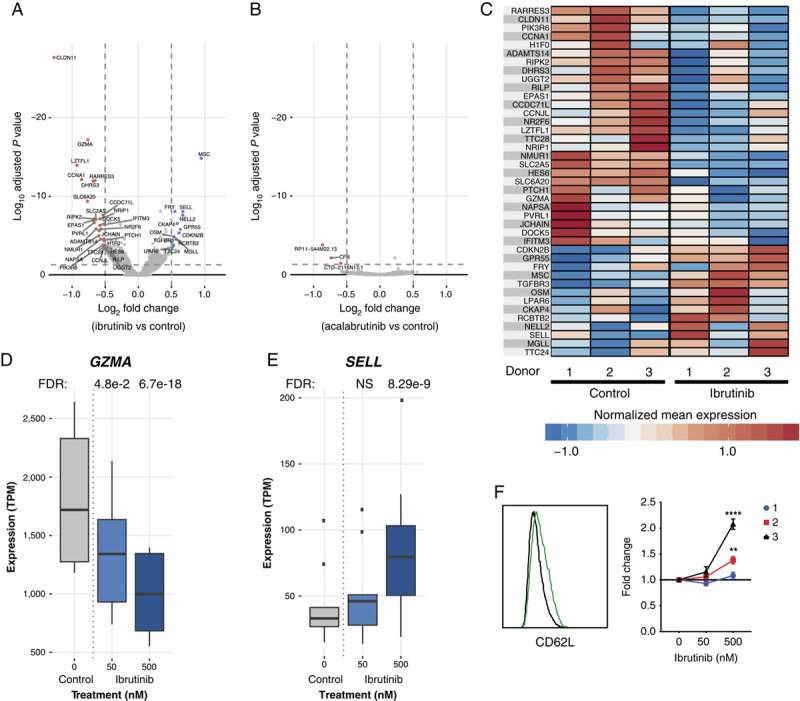
Molecular signature of ibrutinib-treated cells suggests the emergence of type 1 T-helper memory-like T-cell phenotype. A, Volcano plot depicting differentially expressed genes from day 18 serially stimulated CAR T cells with ibrutinib 500 nM compared with control. Significantly differentially upregulated and downregulated genes (FDR<0.05, abslog2FC>0.5) are labeled and colored in red and blue, respectively. B, Volcano plot depicting differentially expressed genes from day 18 serially stimulated CAR T cells with acalabrutinib 1581 nM compared with control. Significantly differentially upregulated and downregulated genes (FDR<0.05, abslog2FC>0.5) are labeled and colored in red and blue, respectively. C, Gene expression profiles of differentially expressed genes across 3 donors. Heat map depicts normalized expression (mean transcripts per million per donor+condition, z-score normalized per gene) of the differentially expressed genes between the ibrutinib 500 nM and control treatments. D and E, GZMA and SELL (CD62L) exhibit an ibrutinib dose-dependent decrease and increase in expression, respectively. Gene expression (transcripts per million) profiles are summarized across donors and experiments per condition. F, Histogram of CD62L expression in donor 3 after 18 days of serial stimulation; FC in the percentage of CD62L+ CAR T cells normalized to control measured by flow cytometry. Data from 2 independent experiments (mean±SEM). Statistically significant differences are indicated as **P<0.01 and ****P<0.0001. CAR indicates chimeric antigen receptor; FC, fold change; FDR; false discovery rate; NS, not significant.