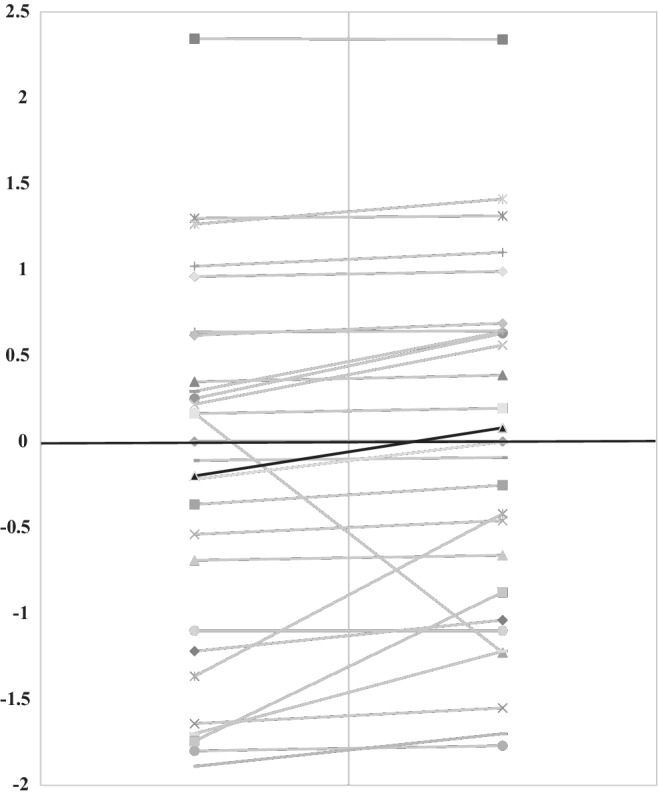
Figure 1.

Changes in participants' Z‐scores for weight at baseline and after completing the low FODMAP diet. The Z‐score for weight at baseline and after following the low FODMAP diet in 29 children with functional bowel disorders. The gray lines indicate individual patient data, and the black line indicates the mean values in the population (Baseline‐0.2, Post‐LFD 0.08).
