
Figure 5.
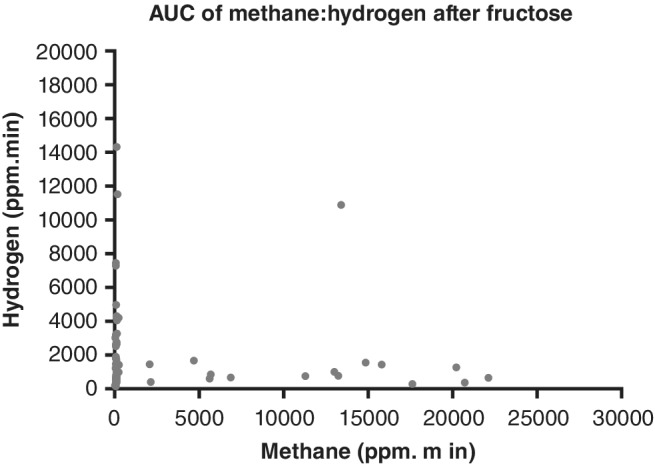
Area under the curve (AUC) of methane produced during 2‐h testing compared to the AUC of hydrogen after patients consumed 35 g of fructose dissolved in 200 mL water. Breath hydrogen and methane levels were measured by gas chromatography on a GastroCH4ECK (Bedfont Scientific Ltd., Kent, UK).