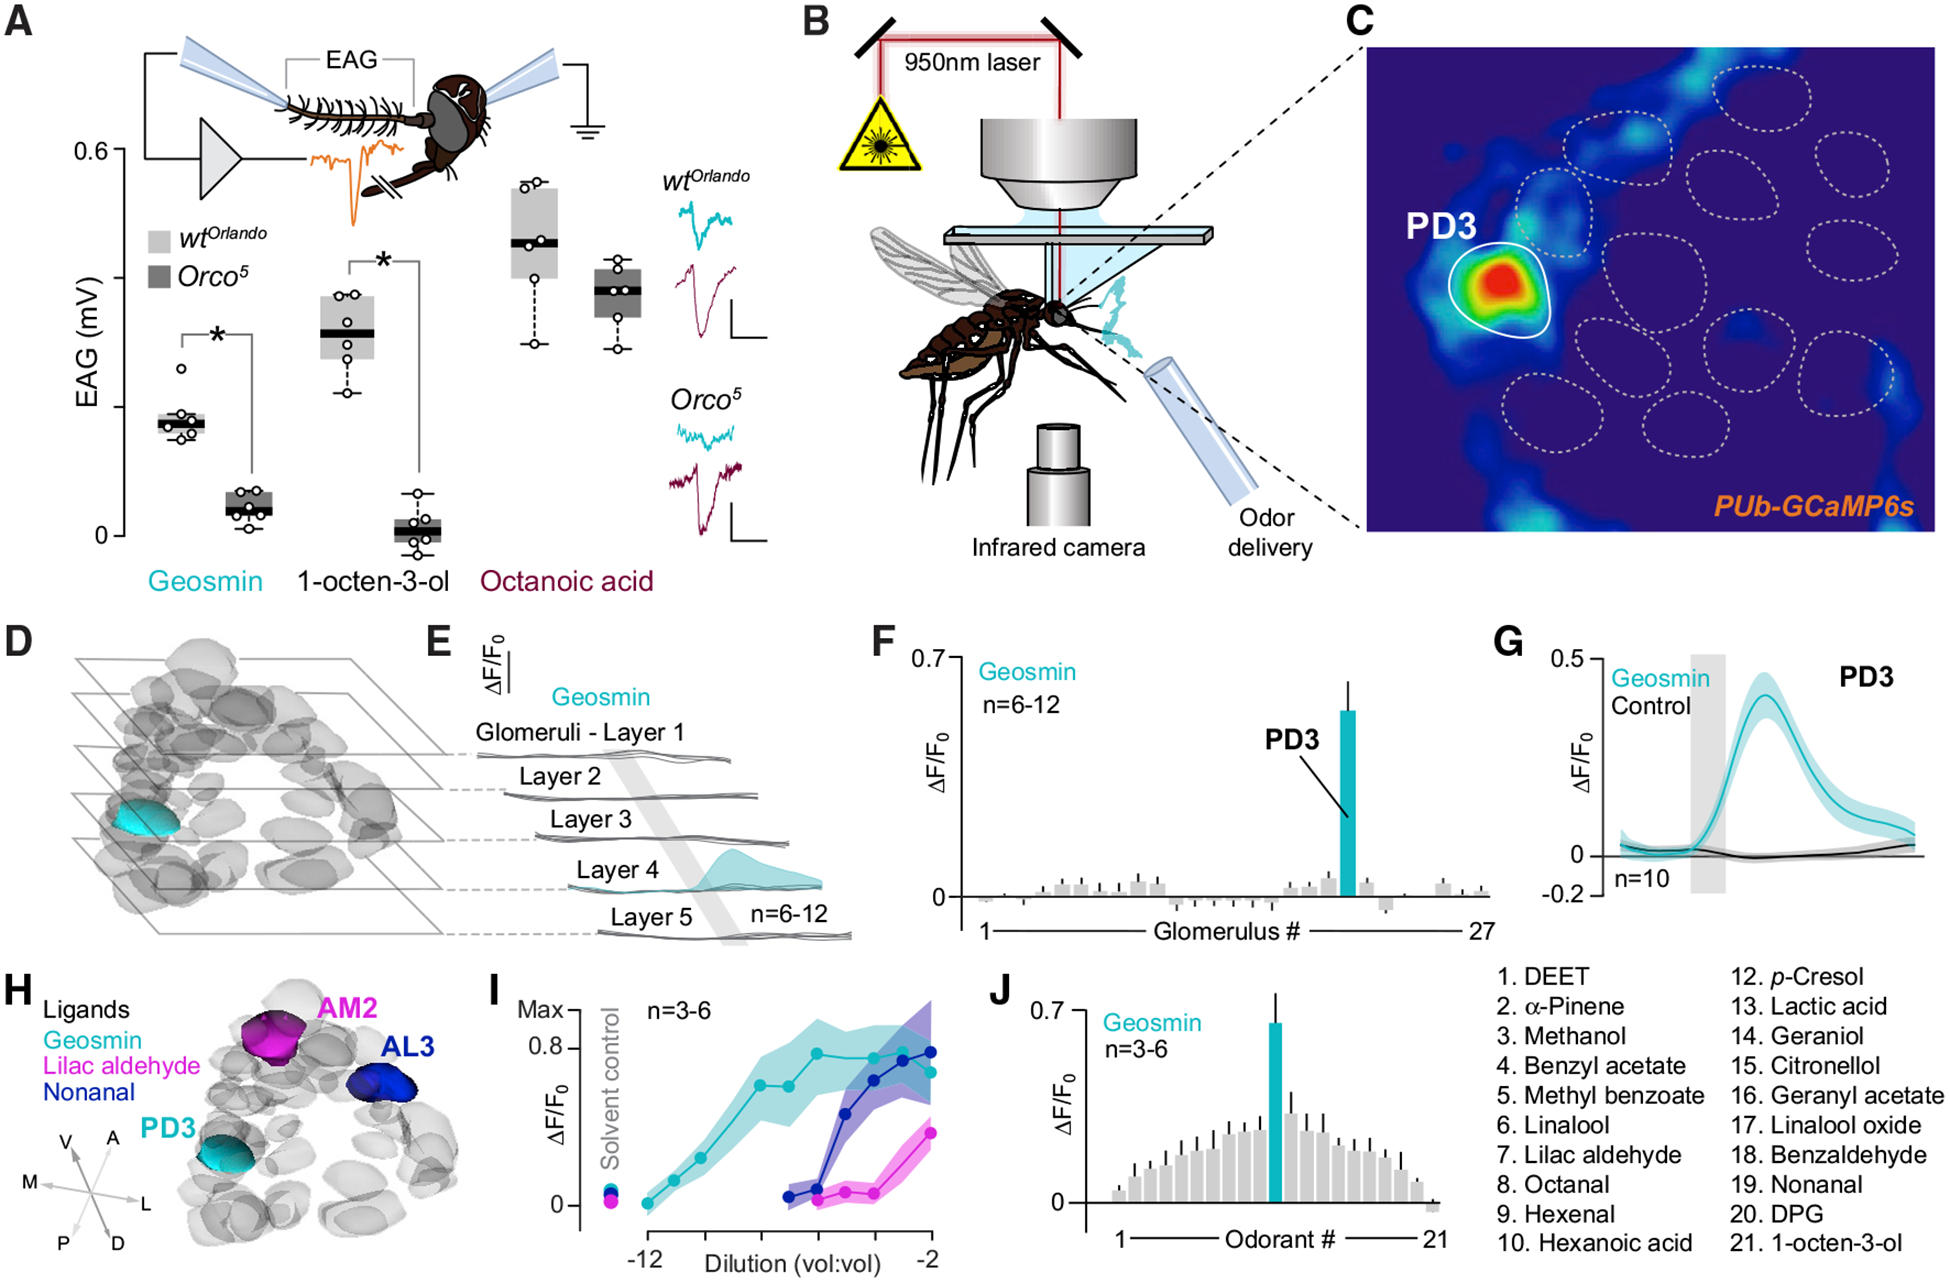
Figure 3. Geosmin Elicits Robust Responses in the Aedes Antennae and AL.

(A) Schematic of the electroantennogram (EAG) preparation (top). EAG responses from WT and Orco mutants to stimulation with 10−3 dilutions of geosmin, 1-octen-3-ol, and octanoic acid are shown. On the right, representative recordings are shown. Vertical scale bar: 0.25 mV; horizontal scale bar: 5 s. Statistical difference was measured via a Student’s t test. Star denotes significant difference (p < 0.05).
(B) Schematic of the two-photon setup used to record calcium dynamics in the mosquito antennal lobe (AL).
(C) Pseudocolor plot from a single preparation of ΔF/F0 calcium responses (0 to 1 scale) to geosmin (10−3 dilution), at a depth of 75 mm from the surface of the AL. Geosmin evoked a strong response in one glomerular region of interest (highlighted in white).
(D) Non-responsive AL glomeruli (gray) and the geosmin-responsive glomerulus (green; the third posterodorsal glomerulus [PD3]) tentatively registered and mapped to an AL atlas and cross-referenced to a previously published atlas [19].
(E) Glomerular responses (ΔF/F0) to geosmin characterized at five depths (15, 30, 50, 75, and 90 μm) from the ventral surface of the AL. Each trace is the mean of one glomerulus; the PD3 response is shown in green. Vertical scale bar: 0.4%. Grey bar denotes stimulus duration (2 s).
(F) Responses to geosmin across all sampled glomeruli; only the PD3 glomerulus (bar in green) showed significant calcium dynamics to geosmin compared to the solvent control (Kruskal-Wallis test: p < 0.05). Glomerular nos. 1–27 were tentatively mapped to PM1, PM2, V1–3, AM2–5, AL3, LC2, LC1, AC1, AL1, AL2, PL2, MC2, PL4, PD1, PD3, PC1, MD1–3, PD4, PD2, and AD1, respectively. Bars represent the mean ± SEM.
(G) Dynamics of the calcium response to geosmin (green trace) and the solvent control (dipropylene glycol [DPG], black trace) for the putative PD3 glomerulus. Lines are the mean; shaded areas are the SEM. Grey bar denotes stimulus duration (2 s).
(H) AL atlas showing the tentatively identified PD3 glomerulus (green), which is responsive to geosmin; the AL3 glomerulus (blue), responsive to nonanal; and the AM2 glomerulus (magenta), responsive to lilac aldehyde.
(I) Concentration dependency of glomeruli tentatively identified as PD3, AL3, and AM2 to their cognate odorants (geosmin, nonanal, and lilac aldehyde, respectively). The glomeruli showed significantly different dose response curves (F1,105 = 21.5; p < 0.05), with the PD3 glomerulus having the lowest EC50 (10−9 concentration) compared to AL3 (10−5) or AM2 (10−4). Lines are the mean; shaded areas are the SEM.
(J) Tuning curve for the PD3 glomerulus to a panel of 21 odorants, each tested at 10−2 concentration.
See also Figure S1.
