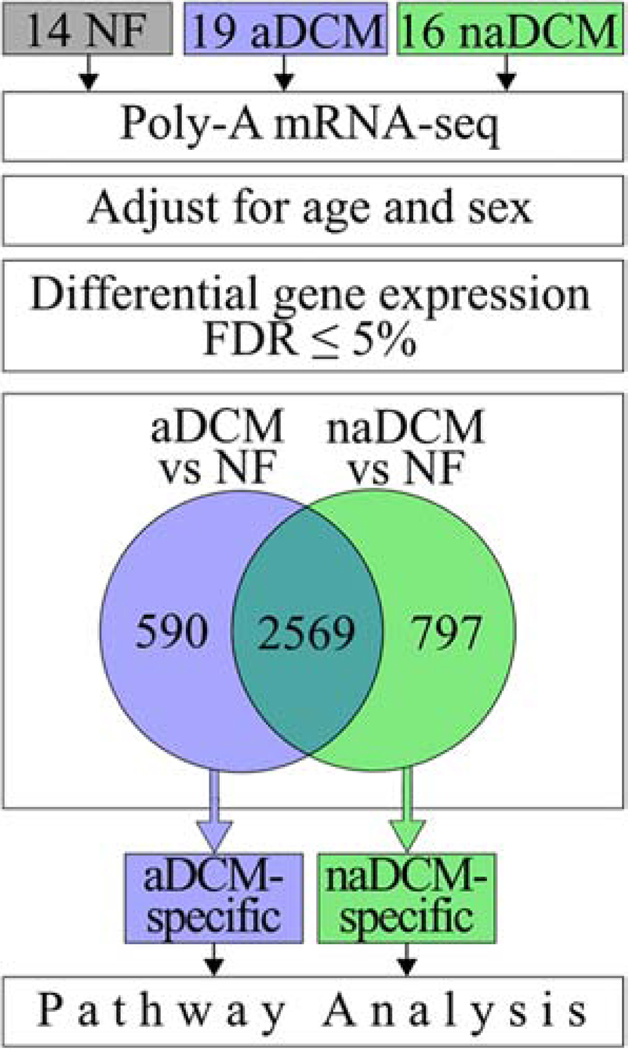
Figure 1. Schematic of RNA-seq analysis [COLOR, 1 column].
mRNA from 49 human hearts was extracted, sequenced, and adjusted for covariates. 14 NF (grey), 19 aDCM (blue) and 16 naDCM (green) explanted LVs were analyzed. DEGs at a 5% FDR were compared between each sub-phenotype and NF controls. Sub-phenotypic genes were identified and used in pathway analysis.

