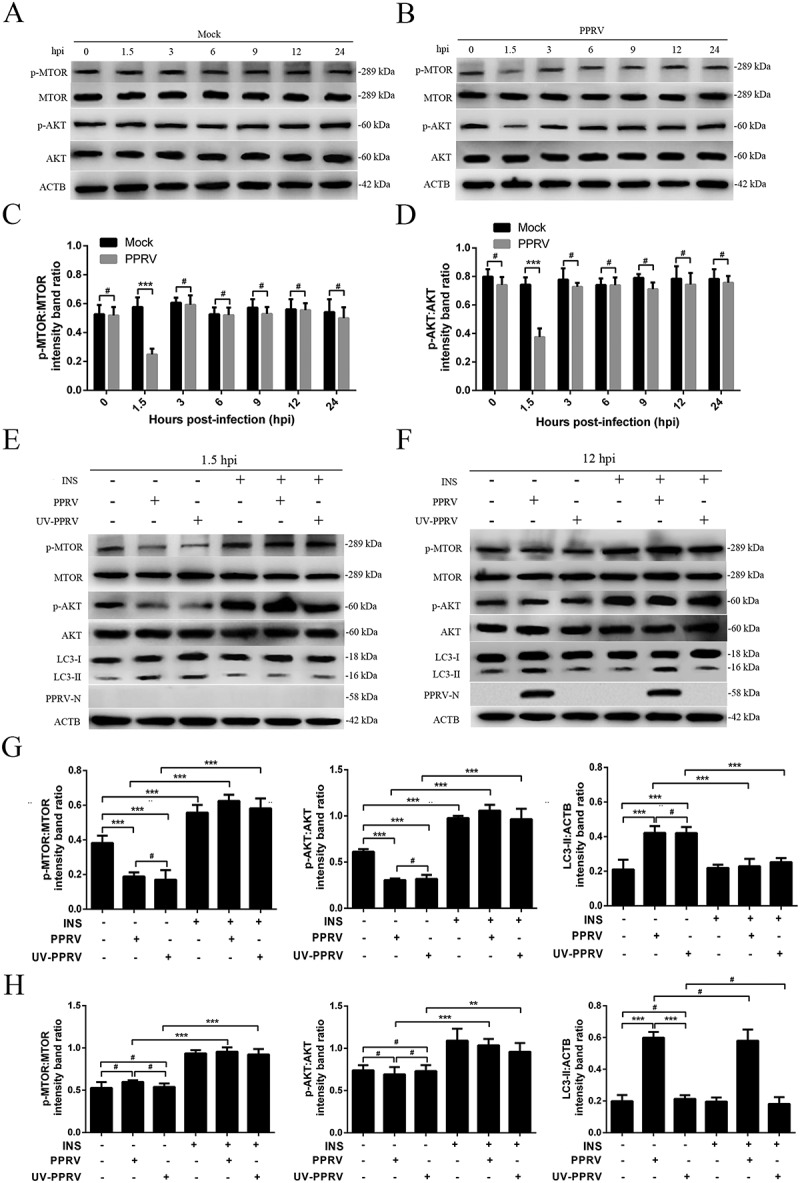
Figure 3.

The role of the AKT-MTOR pathway in PPRV-induced autophagy in host cells. (A and B) EECs were mock-infected or infected with PPRV (MOI = 3). The cells were harvested at 1.5, 3, 6, 9, 12 and 24 h and then immunoblotted with anti-p-MTOR, anti-MTOR, anti-p-AKT, anti-AKT, and anti-ACTB antibodies. (C) The p-MTOR levels relative to the MTOR levels were determined by densitometry. (D) The p-AKT levels relative to the AKT levels were determined by densitometry. (E and F) EECs were pre-treated with INS (1 μM) for 6 h prior to viral infection. Then, the cells were infected with PPRV or UV-irradiated PPRV (MOI = 3) for 1.5 or 12 h. The cell samples were analyzed by immunoblotting with anti-p-MTOR, anti-MTOR, anti-p-AKT, anti-AKT, anti-LC3, anti-PPRV-N and anti-ACTB (loading control) antibodies. (G) The relative target protein levels in the INS-pre-treated cells at 1.5 hpi were determined by densitometry. (H) The relative target protein levels in the INS-pre-treated cells at 12 hpi were determined by densitometry. The data represent the mean ± SD of three independent experiments. Two-way ANOVA; **P < 0.01; ***P < 0.001; #P > 0.05.
