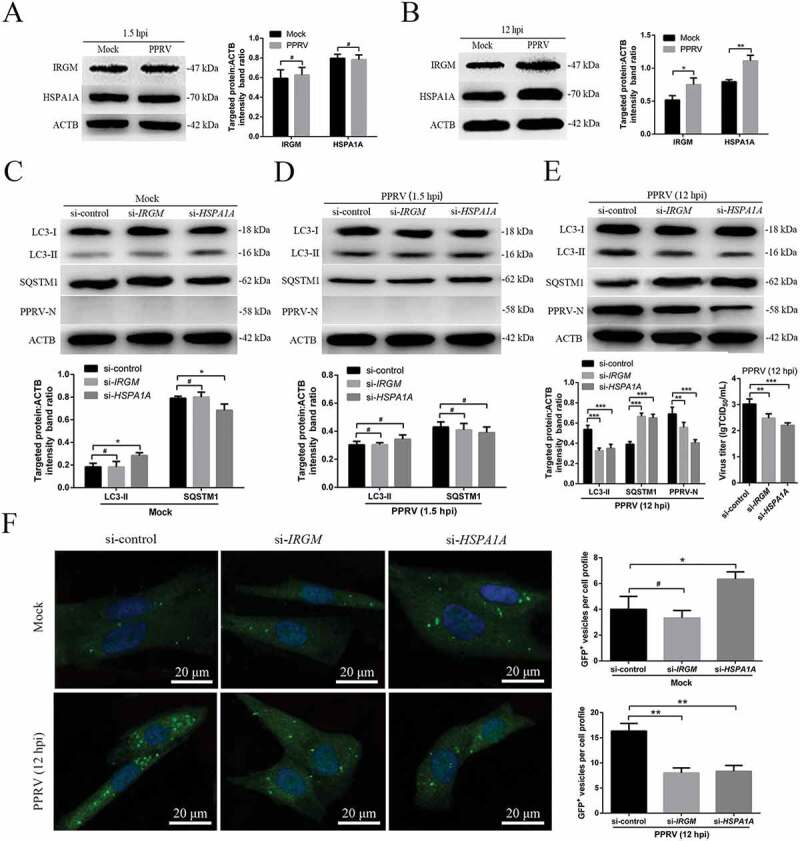
Figure 6.

The second wave of autophagy induced by PPRV depends on IRGM and HSPA1A. (A and B) EECs were mock-infected or infected with PPRV (MOI = 3) for 1.5 or 12 h. At the end of the infection period, the IRGM, HSPA1A and ACTB (loading control) expression levels were analyzed by immunoblotting with specific antibodies. The target protein levels relative to the ACTB levels were determined by densitometry. (C-E) EECs were treated with si-control, si-IRGM or si-HSPA1A and infected with PPRV (MOI = 3) for 1.5 or 12 h. The cell samples were analyzed by immunoblotting with anti-LC3, anti-SQSTM1, anti-PPRV-N and anti-ACTB (loading control) antibodies. The target protein levels relative to the ACTB levels in the siRNA-transfected cells were determined by densitometry. The viral titers were measured using the TCID50 method. (F) GFP-LC3 EECs were treated with si-control, si-IRGM or si-HSPA1A and infected with PPRV (MOI = 3) for 12 h. Autophagy was monitored by evaluating the number of GFP+-LC3 vesicles per cell profile by confocal immunofluorescence microscopy. Scale bars, 20 μm. The corresponding graph shows the number of GFP+-LC3 vesicles per cell profile among the siRNA pre-treated EECs. The data represent the mean ± SD of three independent experiments. Two-way ANOVA; *P < 0.05; **P < 0.01; ***P < 0.001; #P > 0.05.
