Figure 6.

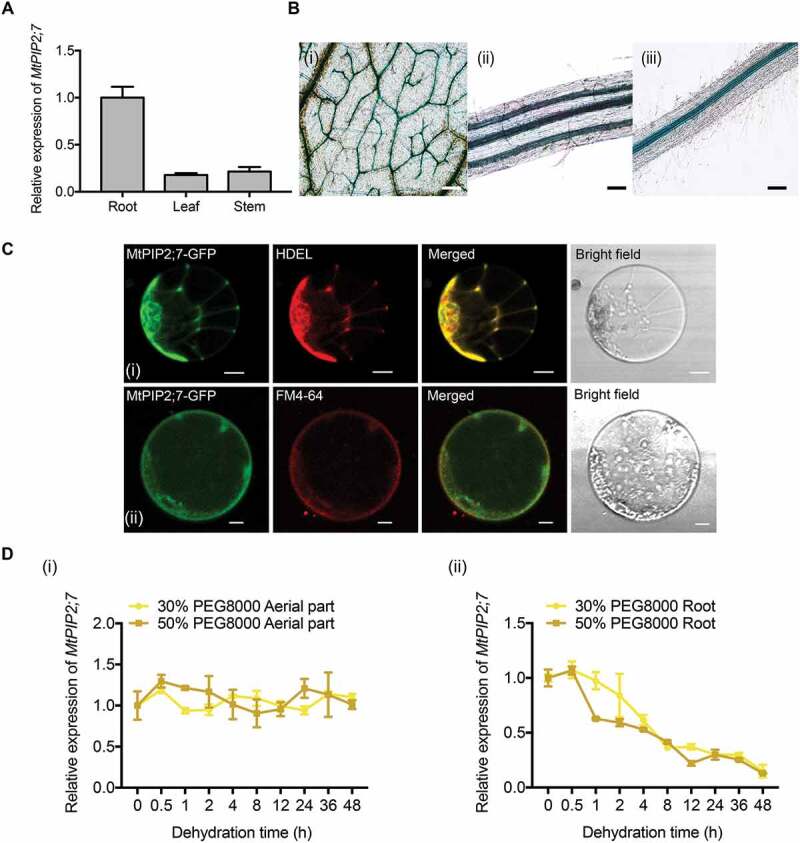
Expression pattern of MtPIP2;7. (A) Tissue expression patterns of MtPIP2;7 in roots, stems and leaf under well-watered conditions. The values were normalized to Actin expression. The data represent the mean±SD of 3 replicates. (B) GUS staining of MtPIP2;7pro:GUS transgenic Medicago truncatula. (i) Vascular bundles in leaves, bar: 200 μm. (ii) Vascular bundles in stems, bar: 100 μm. (iii) Vascular bundles in roots, bar: 200 μm. (C) Subcellular localization of MtPIP2;7-GFP driven by CaMV35S in Arabidopsis protoplasts. Arabidopsis protoplasts were co-transformed with HDEL-RFP and MtPIP2;7-GFP (i). Protoplasts expressing MtPIP2;7-GFP were stained with FM 4–64 (ii). The fluorescence signals were detected via confocal laser scanning microscopy with 488 nm and 546 nm excitation. FM 4–64, a cellular membrane-specific lipophilic dye. Bar: 10 μm. (D) Relative expression of MtPIP2;7 in aerial parts (i) and roots (ii) under dehydration conditions (30% and 50% PEG 8000 treatment, respectively) at the indicated time points. The values were normalized to ACTIN expression. The data represent the mean±SD of 3 replicates.
