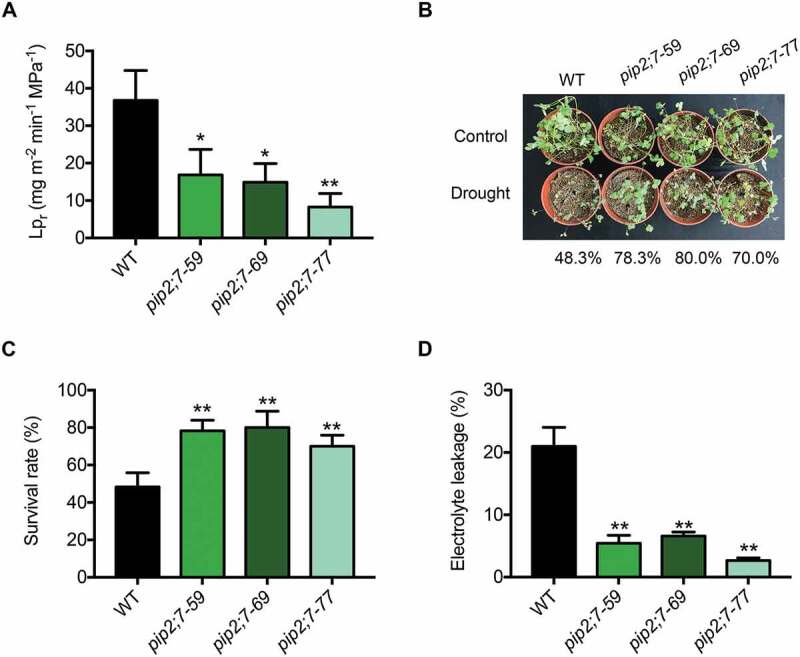
Figure 7.

Function of MtPIP2;7 in M. truncatula. (A) Root hydraulic conductivity (Lpr) in wild-type and pip2;7 mutant plants in the absence of stress. The data represent the mean±SD of 3 replicates with 10 plants each. Asterisks indicate statistically significant differences between wild-type and pip2;7 mutant plants. *P < 0.05, and **P < 0.01, Student’s t-test. (B) Wild-type and pip2;7 plants were grown in soil at 24°C under 16-h light/8-h dark conditions. Two-week-old plants were exposed to drought stress for 7 d and rewatered, representing a drought-rewatering cycle. After 3 drought-rewatering cycles, the pip2;7 mutant and wild-type phenotypes were scored. (C) Survival rate of (B). The data represent the mean±SD of 3 replicates. Asterisks indicate statistically significant differences between wild-type and pip2;7 mutant plants, *P < 0.05, and **P < 0.01, Student’s t-test. (D) Electrolyte leakage of (B). The data represent the mean±SD of 3 replicates. Asterisks indicate statistically significant differences between wild-type and pip2;7 mutant plants, *P < 0.05, and **P < 0.01, Student’s t-test.
