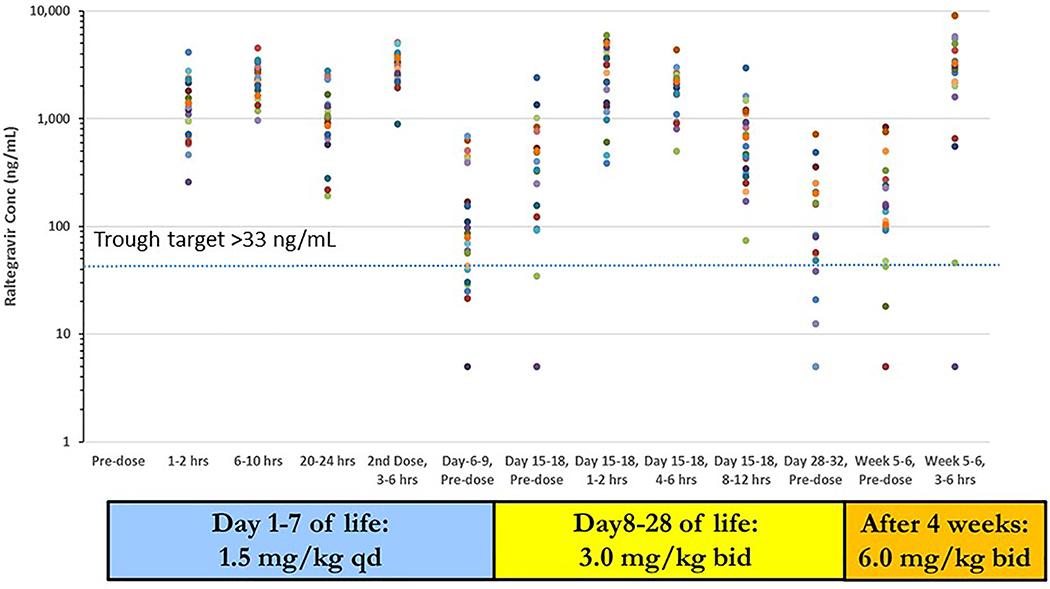
Figure 1:
Raltegravir concentrations for raltegravir-naïve cohort 2 infants plotted against collection time. Plasma concentration vs. time points for each infant are represented with a different color. Dotted line represents trough concentration target of 33 ng/mL. Concentrations below the lower limit of quantitation (10 ng/mL) are plotted at 5 ng/mL.

