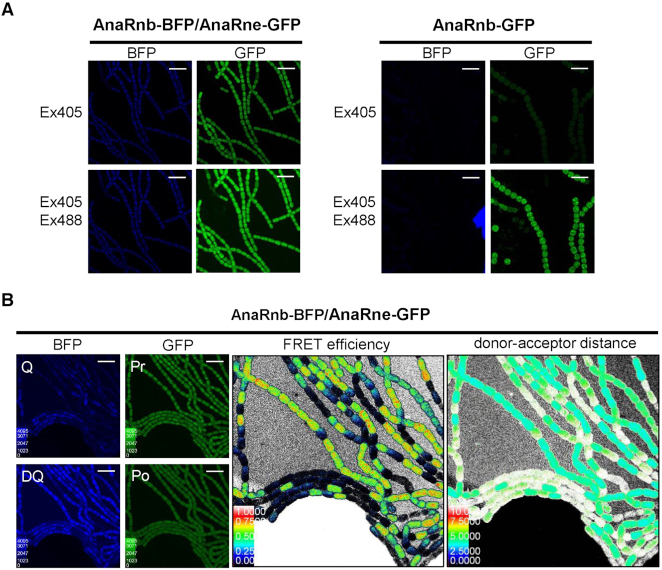
Figure 5.
Examining the intracellular interaction between AnaRnb and AnaRne by FRET. (A) Checking the FRET between AnaRne-GFP and AnaRnb-BFP using the sensitized emission method. For the dual-labelled strain (left), GFP fluorescence could be observed at the BFP excitation wavelength (405 nm), indicating energy transfer from AnaRne-BFP to AnaRne-GFP; while for the GFP-labeled control strain (right), GFP fluorescence was emitted only at the GFP excitation wavelength (488 nm). Scale bar: 5 μm. (B) Measurement of the FRET efficiency between AnaRnb-BFP and AnaRne-GFP by the acceptor photobleaching method. The filaments of the dual-labelled cells were imaged in the GFP and BFP channels before and after the acceptor AnaRne-GFP was photobleached (left panel). Q and DQ are the fluorescence signals for the quenched and dequenched state of the donor protein. Pr and Po are the fluorescence signals for the acceptor before and after photobleaching. The middle and right panels are the color intensity maps showing the FRET efficiency and distance between donor and acceptor calculated from the ratio of the donor fluorescence signals measured before and after photobleaching of the acceptor. Scale bar: 10 μm.

